Running an A/B test is easy. Measuring it correctly is where most teams get it wrong. They call tests too early, measure the wrong metric, or miss confounding variables that invalidate the results.
This guide covers how to properly measure A/B tests for deep link campaigns, from choosing the right metric to knowing when a result is real.
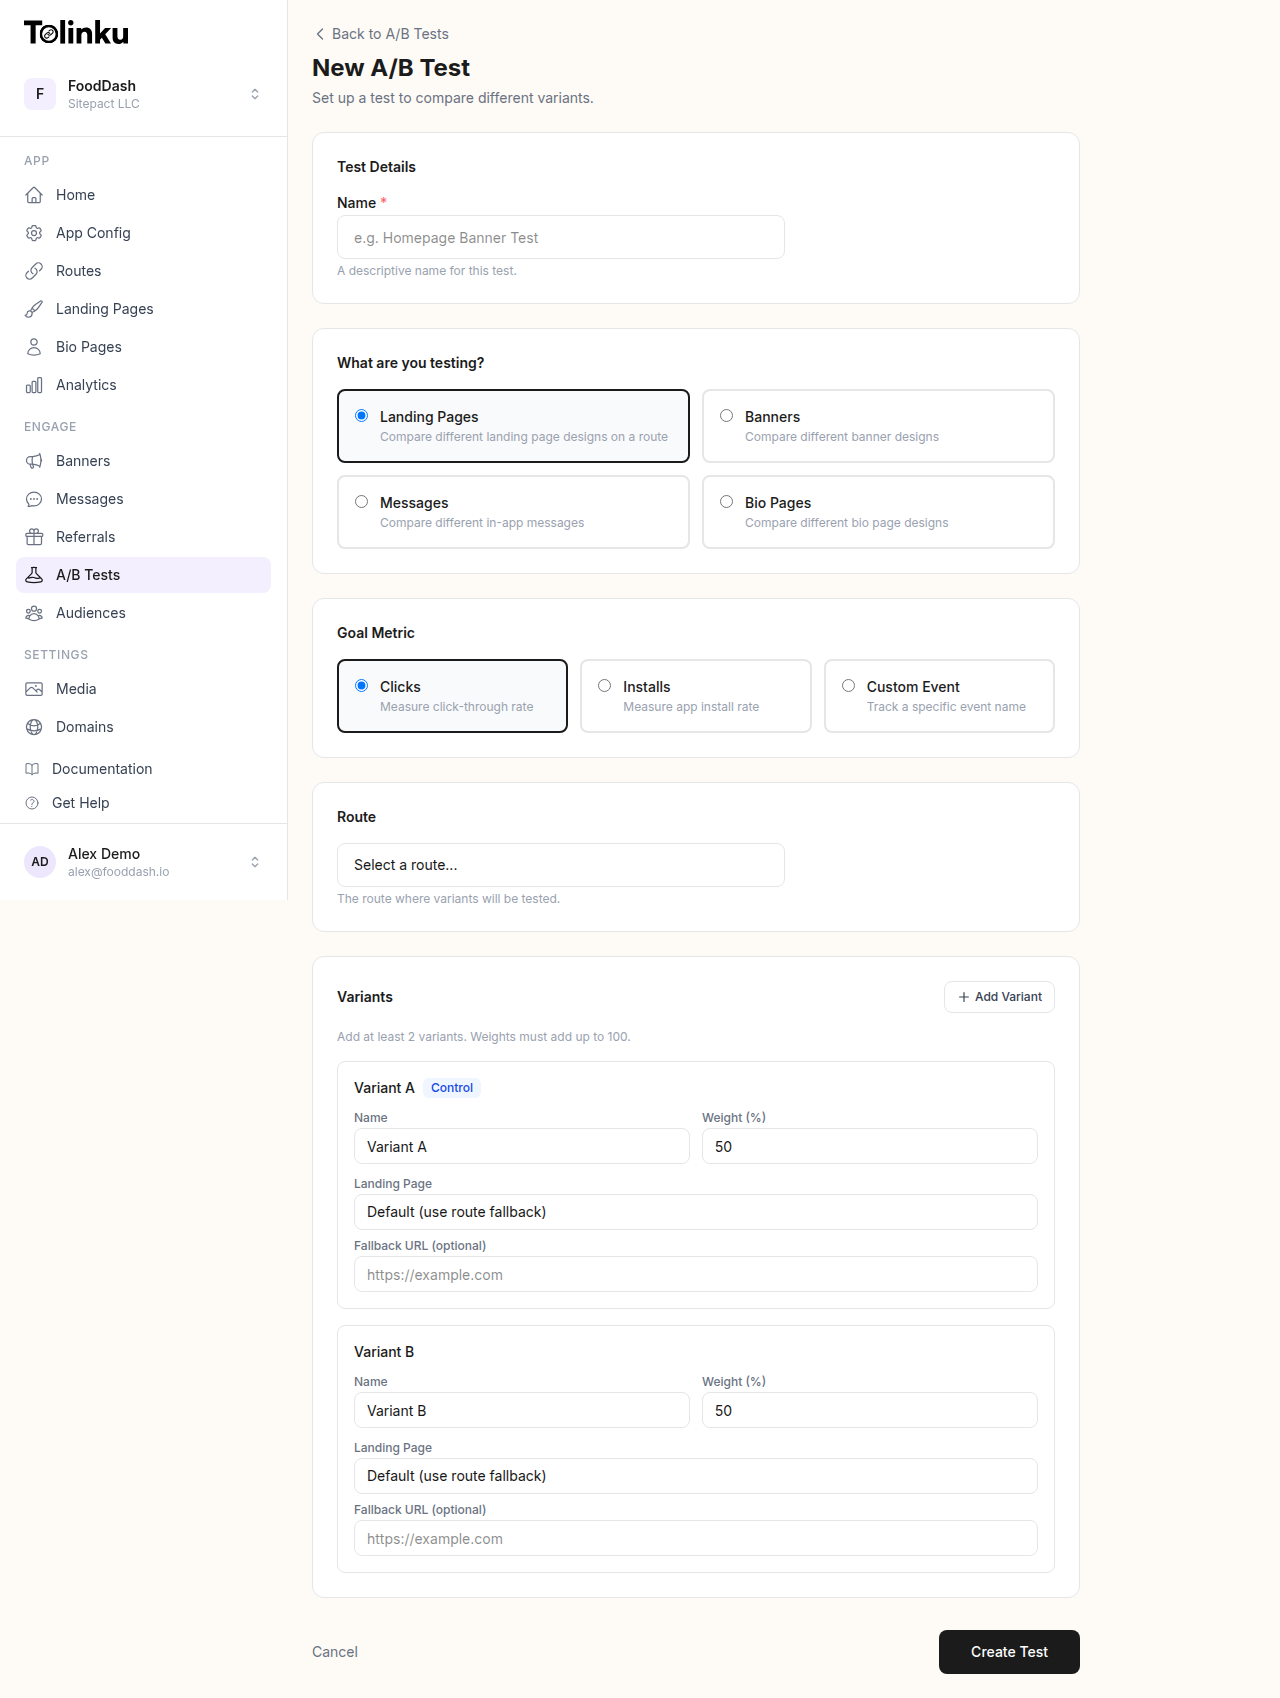 The A/B test creation form with test type, goal metric, route picker, and variant builder.
What to Measure
Primary Metric
Every A/B test needs one primary metric that determines the winner. Not three metrics. Not "whichever one looks best." One metric, defined before the test starts.
For deep link tests, common primary metrics:
| Test Type | Primary Metric |
|---|---|
| Link preview optimization | Click-through rate (CTR) |
| Landing page test | Install rate or signup rate |
| Onboarding flow test | Activation rate |
| CTA copy test | Click-through rate |
| Fallback page test | Web-to-app conversion rate |
| Referral link test | Referral conversion rate |
Choose the metric closest to the behavior you're trying to change. If you're testing different link previews, CTR is the primary metric, not downstream purchase rate (too far removed from what you changed).
Secondary Metrics
Track 2-3 secondary metrics as guardrails. These ensure your winning variant isn't improving the primary metric at the expense of something else.
Example: A link preview test with CTR as the primary metric should also track:
- Install rate (are the clicks converting downstream?)
- Bounce rate on the landing page (are clicks high quality?)
- D1 retention of users who clicked (are these good users?)
If variant B has 20% higher CTR but 40% lower install rate, the CTR win is misleading.
Sample Size and Duration
Why Sample Size Matters
Small samples produce unreliable results. With 50 clicks per variant, random noise can easily make one variant look 30% better when there's no real difference. With 5,000 clicks per variant, a 5% difference is detectable and meaningful.
Calculating Required Sample Size
The sample size you need depends on:
- Baseline conversion rate: Your current CTR or conversion rate
- Minimum detectable effect (MDE): The smallest improvement worth detecting
- Statistical significance level: Typically 95% (p < 0.05)
- Statistical power: Typically 80%
Rough guidelines for 95% confidence and 80% power:
| Baseline Rate | Detect 10% Relative Change | Detect 20% Relative Change |
|---|---|---|
| 2% | ~15,000 per variant | ~4,000 per variant |
| 5% | ~6,000 per variant | ~1,500 per variant |
| 10% | ~3,000 per variant | ~800 per variant |
| 20% | ~1,500 per variant | ~400 per variant |
These are per-variant numbers. For a two-variant test, you need 2x this total.
Test Duration
Don't stop a test the moment it reaches the required sample size. Run it for at least 7 full days to account for:
- Day-of-week effects: User behavior varies by day (weekday vs weekend)
- Time-of-day effects: Morning clicks behave differently than evening clicks
- Novelty effects: Early results may be inflated by novelty (especially for UI changes)
A one-week minimum ensures you've captured a full cycle of user behavior patterns.
Statistical Significance
What It Means
Statistical significance tells you the probability that the observed difference is real, not random noise. At 95% confidence, there's only a 5% chance the difference you're seeing is due to chance.
How to Check
Most A/B testing platforms calculate significance automatically. If you're calculating manually, the chi-squared test works for conversion rate comparisons:
- Create a 2×2 contingency table (variant A/B by converted/not converted)
- Calculate the chi-squared statistic
- Look up the p-value
- If p < 0.05, the result is statistically significant at 95% confidence
Or use an online calculator. Input your sample sizes and conversion counts for each variant.
Common Significance Mistakes
Peeking: Checking results daily and stopping when p < 0.05 inflates false positive rates dramatically. If you check a test 10 times during its run, your effective false positive rate can be 30-40%, not 5%.
Solution: Define the sample size and duration before starting. Check results at the end, not continuously. If you must monitor during the test, use sequential testing methods (like the Benjamini-Hochberg procedure) that account for multiple looks.
Multiple comparisons: Testing 5 variants against a control means 5 comparisons. With 95% confidence per comparison, there's a 23% chance at least one is a false positive.
Solution: Apply a correction (like Bonferroni: divide your significance threshold by the number of comparisons). Or limit tests to 2-3 variants maximum.
Interpreting Results
Significant Winner
If variant B has a statistically significant higher primary metric and secondary metrics aren't worse, implement variant B. Document the result and the magnitude of improvement.
No Significant Difference
If neither variant wins after reaching the required sample size, the variants perform similarly. This is a valid result, not a failure. Implement whichever variant is simpler or more maintainable.
Significant But Small Effect
A result can be statistically significant but practically insignificant. A 0.1% CTR improvement on 100,000 clicks is statistically significant but adds only 100 clicks. Consider whether the improvement is worth the implementation complexity.
Conflicting Metrics
Sometimes variant B wins on the primary metric but loses on a secondary metric. This requires judgment:
- If variant B has 15% higher CTR but 5% lower install rate, it's probably still a win (the CTR gain outweighs the install rate drop in absolute terms)
- If variant B has 10% higher CTR but 30% lower revenue per user, it's probably a loss (you're attracting more low-quality clicks)
Calculate the net impact on your bottom-line metric (revenue, active users, or whatever matters most).
A/B Testing Deep Link Elements
Link Preview Tests
Test different OG metadata on the same route:
- Variant A: Product image with price in the preview
- Variant B: Lifestyle image with benefit statement
Split traffic using your deep linking platform's A/B testing feature and measure CTR per variant.
Landing Page Tests
For users without the app installed, test different fallback web pages:
- Variant A: Simple page with app store badges
- Variant B: Interactive preview of the app's content with a download CTA
Measure install rate (clicks that result in an app install).
CTA Copy Tests
Test different call-to-action text in emails, social posts, or landing pages:
- "Download free" vs "Start your trial" vs "Get the app"
Keep everything else identical. Measure CTR on the link.
Redirect Flow Tests
Test different redirect strategies for new users:
- Variant A: Direct to app store
- Variant B: Intermediate landing page before app store
Measure install rate and first-session activation rate.
For more on setting up A/B tests for deep links, see A/B Testing Deep Links and Landing Pages.
Documenting and Learning
Test Log
Maintain a test log that records:
| Field | Example |
|---|---|
| Test name | Link preview image test – Summer campaign |
| Hypothesis | Product images drive higher CTR than lifestyle images |
| Primary metric | CTR |
| Secondary metrics | Install rate, D1 retention |
| Start date | 2026-04-15 |
| End date | 2026-04-22 |
| Sample size (A/B) | 5,200 / 5,100 |
| Result | Variant B won: 4.8% vs 3.9% CTR (p = 0.012) |
| Decision | Implement variant B for all summer campaign links |
| Notes | Install rate was not significantly different between variants |
Building Institutional Knowledge
Over time, your test log becomes a knowledge base:
- "Lifestyle images consistently outperform product images in social media previews"
- "Shorter CTAs (under 4 words) perform better in push notifications"
- "Users who land on personalized deep link destinations retain 2x better than generic landing pages"
This knowledge prevents re-testing things you've already proven and helps new team members understand what works.
Common Testing Mistakes
No hypothesis: Running a test without a clear hypothesis means you won't know how to interpret the result. Always start with "We believe [change] will improve [metric] because [reason]."
Testing too many things at once: Changing the image, title, description, and CTA simultaneously means you don't know which change caused the result. Test one variable at a time.
Stopping too early: Seeing variant B ahead after 200 clicks doesn't mean it's the winner. Wait for statistical significance and the minimum test duration.
Ignoring segment differences: A variant might win overall but lose for a specific segment (iOS users, users from a particular channel). Check segment-level results before rolling out broadly.
Not implementing winners: A surprising number of teams run tests, find winners, and never implement them. Build a process for acting on test results.
For a comprehensive view of analytics for deep links, see Deep Link Analytics: Measuring What Matters. For funnel analysis that complements A/B testing, see Conversion Funnel Analysis for Deep Links.
Get deep linking tips in your inbox
One email per week. No spam.