Referral programs have a reputation for being "free" growth. They're not. You're paying rewards to referrers and referred users. You're spending engineering time building and maintaining the system. You're spending product time on the sharing flow, the landing page, and the onboarding experience for referred users. The question is whether all of that investment generates more value than it costs.
Measuring referral program ROI requires tracking costs that are easy to miss and attributing revenue over long time horizons. This guide covers the formulas, the data you need, and the benchmarks to compare against. For the metrics dashboard, see the referral program analytics guide. For the general program framework, see building referral programs that actually work.
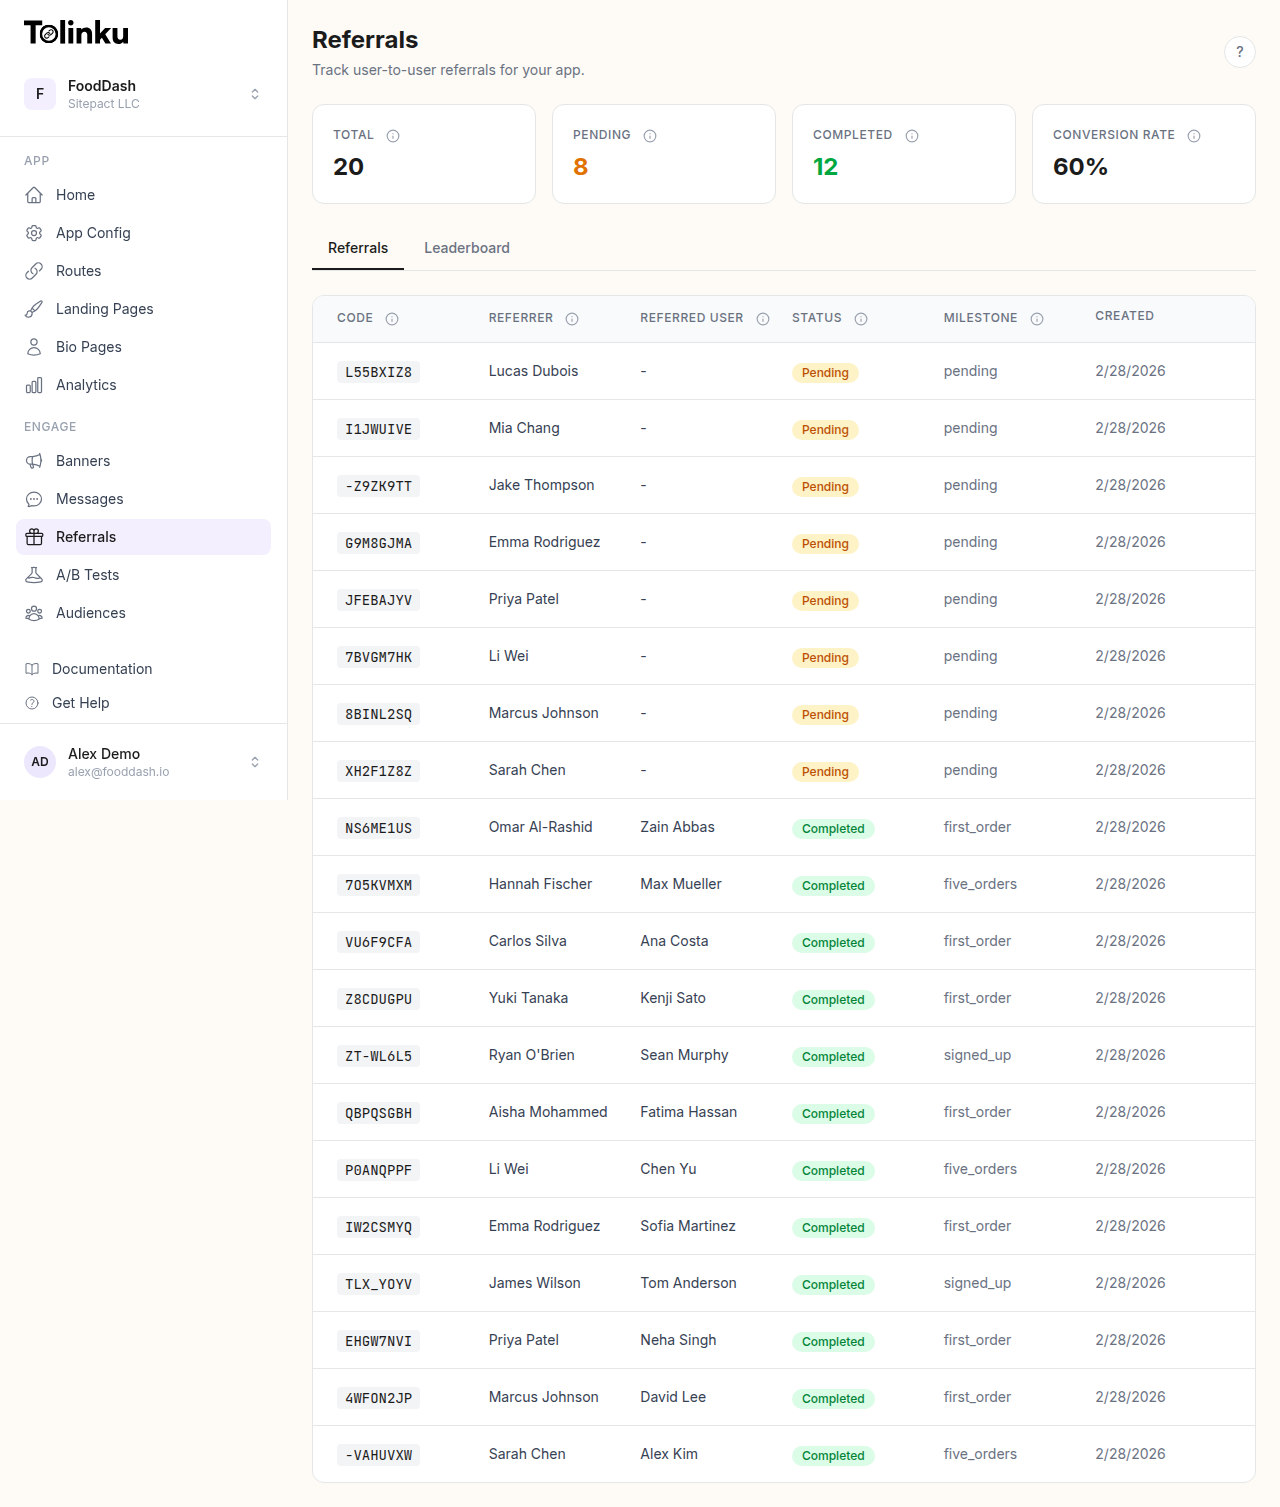 The referrals page with stats cards, referral list, and leaderboard tabs.
The ROI Formula
Referral Program ROI = (Revenue from Referred Users - Total Program Cost) / Total Program Cost × 100
Simple in principle. The complexity is in accurately calculating the numerator and denominator.
Calculating Revenue from Referred Users
Lifetime Value of Referred Users
The most important number. Referred users typically have 15-25% higher LTV than users acquired through paid channels, according to research from the Wharton School by Christophe Van den Bulte. This happens for two reasons:
- Better product-market fit. People refer friends who are similar to themselves. If the referrer is a good customer, their friends are more likely to be good customers too.
- Higher trust. Referred users start with more confidence in the product, which leads to deeper engagement and longer retention.
Calculate referred user LTV the same way you calculate overall LTV, but for the referred cohort specifically:
Referred User LTV = Average Revenue Per Referred User × Average Lifespan of Referred User
Or, for subscription businesses:
Referred User LTV = ARPU × (1 / Churn Rate)
Compare this against non-referred user LTV to quantify the referral quality premium.
Revenue Attribution Window
How long do you attribute revenue to the referral program? Options:
- First purchase only: Conservative. Measures immediate revenue.
- First 90 days: Captures the initial engagement period.
- Full lifetime: The most accurate but takes years to calculate definitively.
For ROI calculations, use a 12-month window as a practical middle ground. You can project LTV from early retention data using cohort analysis.
Example Calculation
1,000 referred users in Q1
Average revenue per referred user in first 12 months: $120
Total referred revenue: $120,000
Calculating Total Program Cost
Direct Costs
Referrer rewards: Total rewards paid to users who referred friends.
500 successful referrals × $10 per referral = $5,000
Referred user rewards: Total rewards given to new users who were referred.
500 referred users × $10 welcome credit = $5,000
Fraud losses: Rewards paid on fraudulent referrals before detection.
Estimated 5% fraud rate × $10,000 total rewards = $500
Indirect Costs
Engineering time: Hours spent building and maintaining the referral system. Include initial development, ongoing bug fixes, fraud prevention, and A/B testing infrastructure.
Product time: Design and product management hours for the sharing flow, landing page, and referral dashboard.
Support costs: Customer support tickets related to referral issues (missing rewards, expired links, etc.).
Marketing time: Hours spent on referral program communications, email campaigns, and in-app prompts.
Often-Missed Costs
- Reward liability: Outstanding (pending) rewards that haven't been paid yet but will be.
- Tax reporting: Administrative cost of issuing 1099s for users who earn over $600/year in referral rewards (US).
- Cannibalization: Some referred users would have signed up anyway through organic channels. Estimating this requires a holdout group (more on this below).
Example Cost Calculation
Referrer rewards:           $5,000
Referred user rewards:      $5,000
Fraud losses:               $500
Engineering (80 hrs × $75): $6,000
Product/Design (20 hrs):    $2,000
Support (50 tickets × $5):  $250
Marketing (10 hrs):         $750
────────────────────────────
Total Program Cost:         $19,500
Putting It Together
Revenue from referred users: $120,000
Total program cost:          $19,500

ROI = ($120,000 - $19,500) / $19,500 × 100 = 515%
A 515% ROI means that for every dollar spent on the referral program, you generated $5.15 in net value. This is why referral programs, when well-executed, are among the highest-ROI growth channels.
Key Metrics to Track
Cost Per Referred User (CPRU)
CPRU = Total Program Cost / Number of Qualified Referred Users
Compare this against your cost per acquisition (CPA) from other channels:
| Channel | Typical CPA | Notes |
|---|---|---|
| Referral program | $15-40 | Includes all direct and indirect costs |
| Paid search | $30-100 | Varies widely by industry |
| Paid social | $20-80 | Varies by platform and targeting |
| Organic search | $10-30 | Slow to build, high long-term value |
| App store ads | $2-10 CPI | Cost per install, not per qualified user |
The referral CPRU should be competitive with or lower than your paid channels. If it's not, your program needs optimization (see the A/B testing guide).
Referral Coefficient (K-Factor)
The viral coefficient measures how many new users each existing user brings in:
K = Number of referrals sent per user × Conversion rate of referrals
- K < 1: The program supplements growth but doesn't drive viral growth.
- K = 1: Each user generates exactly one new user. Growth is linear.
- K > 1: True viral growth. Each user generates more than one new user, creating exponential growth.
Most programs operate at K = 0.1-0.5. True viral growth (K > 1) is rare and usually temporary.
Payback Period
How long until a referred user generates enough revenue to cover the cost of acquiring them:
Payback Period = CPRU / Monthly Revenue Per Referred User
For a CPRU of $30 and monthly revenue of $15, the payback period is 2 months. After that, the referred user is pure profit (minus operating costs).
Incremental Revenue
Not all referred users are truly incremental. Some would have found your product through other channels. To measure true incrementality, use a holdout group:
- Randomly assign 10-20% of your users to a holdout group.
- Users in the holdout group don't see the referral program.
- Compare the signup rate of friends-of-holdout-users vs. friends-of-program-users.
- The difference is your incremental lift.
This is the gold standard for measuring referral program impact, but it requires sacrificing some potential referrals for measurement accuracy.
Tracking Infrastructure
You need three data sources connected:
- Referral tracking: Which users referred which friends, when, and through what link. Tolinku referral tracking handles the link-level attribution.
- Revenue data: How much revenue each referred user generates over time. This comes from your billing system or app analytics.
- Cost data: Reward payouts, engineering hours, and other program costs. This comes from your finance and project management systems.
Connect these data sources in your analytics warehouse (or even a spreadsheet for early-stage programs) to calculate ROI on an ongoing basis.
Analytics Integration
Use Tolinku analytics for the top of the funnel (link clicks, installs, referral completions) and your product analytics tool for downstream metrics (activation, revenue, retention).
Tolinku webhooks can forward referral events to your analytics pipeline in real time, giving you a connected view from referral link click through to revenue.
Benchmarks
| Metric | Poor | Average | Good | Excellent |
|---|---|---|---|---|
| Referral program ROI | < 100% | 100-300% | 300-500% | > 500% |
| Share rate (% of users who refer) | < 2% | 2-5% | 5-15% | > 15% |
| Referral conversion rate | < 5% | 5-15% | 15-25% | > 25% |
| Cost per referred user | > $50 | $30-50 | $15-30 | < $15 |
| Referred user LTV premium | 0% | 5-10% | 15-25% | > 25% |
| K-factor | < 0.1 | 0.1-0.3 | 0.3-0.5 | > 0.5 |
These benchmarks vary significantly by industry. Fintech and SaaS tend to have higher CPRU but also higher LTV. Consumer apps tend to have lower CPRU but higher volume.
Reporting Cadence
- Weekly: Share rate, referral volume, conversion rate. Operational metrics to catch issues early.
- Monthly: CPRU, fraud rate, reward payouts. Cost metrics for budget tracking.
- Quarterly: LTV of referred cohorts, ROI, K-factor, incrementality. Strategic metrics for program decisions.
- Annually: Full ROI calculation with complete cost accounting. Used for budget planning and executive reporting.
For the complete metrics framework, see the referral program analytics guide. For the general program framework, see building referral programs that actually work.
Get deep linking tips in your inbox
One email per week. No spam.