Deep linking improves the user experience, but does it improve your bottom line? Executives do not fund projects because they are technically elegant. They fund projects that produce measurable business outcomes. This guide shows you how to measure the ROI of deep linking so you can justify the investment and prioritize optimization.
For the benefits of deep linking, see 10 benefits of deep linking for mobile apps. For analytics fundamentals, see deep link analytics: measuring what matters.
The ROI Framework
Costs
| Cost Category | Typical Range | Notes |
|---|---|---|
| Implementation (one-time) | 1-3 weeks of engineering | Basic deep links: 1 week. Deferred + analytics: 2-3 weeks. |
| Deep link platform subscription | $0-200/month | Free tiers available. Paid tiers for higher volume. |
| Ongoing maintenance | 2-4 hours/month | Testing after OS updates, monitoring verification files. |
| Engineering for new routes | 1-2 hours per route | Each new app screen needs a route mapping. |
Benefits
| Benefit | How to Measure | Typical Impact |
|---|---|---|
| Higher conversion from marketing campaigns | Compare deep-linked vs non-deep-linked campaigns | 2-5x higher conversion |
| Better onboarding for new users | Day 1/7 retention: deep-linked vs organic installs | 30-50% better retention |
| Reduced support tickets | Fewer "I can't find X" tickets when links go to the right place | 10-20% reduction |
| More effective referral programs | Referral completion rate with vs without deferred deep links | 2-3x higher completion |
| Higher engagement from re-engagement campaigns | Click-to-action rate for deep-linked push/email | 40-60% higher |
Measuring Conversion Impact
Before vs After Comparison
The simplest measurement: compare campaign performance before and after implementing deep links.
BEFORE deep links (June 2026):
  Email campaign: 50,000 sent, 2,000 clicks, 120 conversions
  Conversion rate: 6.0%
  Revenue: $4,800

AFTER deep links (July 2026):
  Email campaign: 50,000 sent, 2,200 clicks, 310 conversions
  Conversion rate: 14.1%
  Revenue: $12,400

Improvement: +$7,600/month
Deep linking cost: ~$500/month (platform + maintenance)
Monthly ROI: ($7,600 - $500) / $500 = 1,420%
A/B Test Comparison
A more rigorous approach: run the same campaign with and without deep links simultaneously.
SELECT
  variant,
  COUNT(*) AS recipients,
  SUM(CASE WHEN clicked THEN 1 ELSE 0 END) AS clicks,
  SUM(CASE WHEN converted THEN 1 ELSE 0 END) AS conversions,
  ROUND(SUM(CASE WHEN converted THEN 1 ELSE 0 END)::DECIMAL / COUNT(*) * 100, 2) AS conv_rate,
  SUM(revenue) AS total_revenue
FROM email_campaign_results
WHERE campaign = 'july-sale-ab-test'
GROUP BY variant;
| Variant | Recipients | Clicks | Conversions | Conv Rate | Revenue |
|---|---|---|---|---|---|
| A (web link) | 25,000 | 1,000 | 60 | 0.24% | $2,400 |
| B (deep link) | 25,000 | 1,100 | 155 | 0.62% | $6,200 |
Deep links produced 2.6x more conversions and 2.6x more revenue. The 10% higher click rate (CTR) suggests that users may perceive deep links as more trustworthy or relevant.
Measuring Retention Impact
Cohort Comparison
Compare retention between users acquired via deep links and organic users:
SELECT
  acquisition_type,
  COUNT(DISTINCT user_id) AS cohort_size,
  ROUND(COUNT(DISTINCT CASE WHEN day_1_retained THEN user_id END)::DECIMAL /
    COUNT(DISTINCT user_id) * 100, 1) AS day_1_pct,
  ROUND(COUNT(DISTINCT CASE WHEN day_7_retained THEN user_id END)::DECIMAL /
    COUNT(DISTINCT user_id) * 100, 1) AS day_7_pct,
  ROUND(COUNT(DISTINCT CASE WHEN day_30_retained THEN user_id END)::DECIMAL /
    COUNT(DISTINCT user_id) * 100, 1) AS day_30_pct
FROM user_retention
WHERE install_date >= '2026-06-01'
GROUP BY acquisition_type;
| Source | Cohort Size | Day 1 | Day 7 | Day 30 |
|---|---|---|---|---|
| Deep link (content) | 3,200 | 42% | 22% | 14% |
| Deep link (referral) | 800 | 55% | 32% | 20% |
| Organic (app store browse) | 5,000 | 28% | 15% | 8% |
| Paid ad (no deep link) | 2,000 | 22% | 10% | 5% |
LTV by Acquisition Source
SELECT
  acquisition_type,
  COUNT(DISTINCT user_id) AS users,
  ROUND(AVG(lifetime_revenue), 2) AS avg_ltv,
  ROUND(SUM(lifetime_revenue), 0) AS total_ltv
FROM user_ltv
WHERE install_date >= '2026-01-01'
GROUP BY acquisition_type
ORDER BY avg_ltv DESC;
| Source | Users | Avg LTV | Total LTV |
|---|---|---|---|
| Deep link (referral) | 2,400 | $18.50 | $44,400 |
| Deep link (content) | 8,500 | $12.20 | $103,700 |
| Organic | 15,000 | $8.40 | $126,000 |
| Paid ad (no deep link) | 6,000 | $5.80 | $34,800 |
Deep-linked users have 45-120% higher LTV than organic users and 110-220% higher LTV than paid ad users without deep links.
Calculating Total ROI
Annual ROI Model
ANNUAL DEEP LINKING ROI
────────────────────────────────────

COSTS
  Implementation (one-time, amortized)     $8,000
  Platform subscription ($150/mo × 12)     $1,800
  Engineering maintenance (4 hrs/mo × $75) $3,600
  Total annual cost                        $13,400

BENEFITS
  Campaign conversion improvement          $91,200
    ($7,600/mo from email campaigns alone)
  Retention improvement                    $36,000
    (1,800 additional retained users × $20 LTV)
  Referral program improvement             $18,000
    (600 additional referral completions × $30 value)
  Re-engagement improvement                $24,000
    (2,000 additional re-engaged users × $12 value)
  Total annual benefit                     $169,200

NET BENEFIT                                $155,800
ROI                                        1,162%
PAYBACK PERIOD                             ~1 month
Conservative vs Optimistic
| Scenario | Annual Benefit | Annual Cost | ROI |
|---|---|---|---|
| Conservative (min estimates) | $60,000 | $13,400 | 348% |
| Moderate (mid estimates) | $120,000 | $13,400 | 795% |
| Optimistic (max estimates) | $200,000 | $13,400 | 1,393% |
Even the conservative estimate shows deep linking pays for itself many times over for apps with meaningful traffic.
Metrics to Track
Leading Indicators
These predict future ROI:
| Metric | Target | Why It Matters |
|---|---|---|
| App open rate | > 65% | Measures if deep links are actually opening the app |
| Deferred match rate | > 70% | Measures if new users get the right first experience |
| Click-to-conversion time | < 5 minutes | Faster means more relevant landing experience |
| Fallback rate (existing users) | < 20% | High fallback suggests configuration issues |
Lagging Indicators
These confirm ROI:
| Metric | Comparison | Expected Difference |
|---|---|---|
| Conversion rate | Deep-linked vs non-deep-linked | 2-5x higher |
| Day 7 retention | Deep-linked vs organic | 30-50% higher |
| LTV | Deep-linked vs organic | 40-100% higher |
| Revenue per campaign | With vs without deep links | 2-3x higher |
Presenting ROI to Stakeholders
For Engineering Leadership
Focus on technical investment vs outcome:
"Deep linking required 2 weeks of engineering to implement and 4 hours/month to maintain. It increased campaign conversion rates by 2.6x and improved Day 7 retention by 47%. The annual net benefit is $155,800."
For Product Leadership
Focus on user experience impact:
"Users who arrive via deep links see the content they clicked on immediately, instead of landing on the home screen and searching for it. This produces 42% Day 1 retention vs 28% for organic users, meaning deep-linked users are 50% more likely to come back."
For Executive Leadership
Focus on business metrics:
"Deep linking delivers a 1,162% annual ROI. Every dollar spent on deep linking infrastructure returns $12.60 in revenue. The payback period is approximately one month."
Tolinku for ROI Measurement
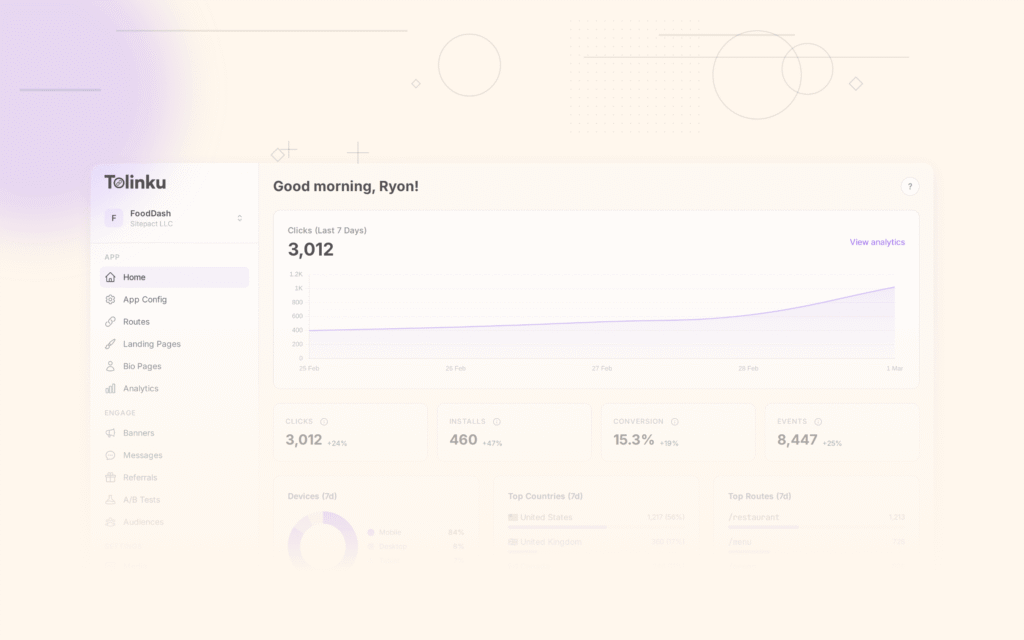
Tolinku's analytics track the metrics you need for ROI measurement: click-through rates, app open rates, conversion rates, and campaign attribution. View performance data in the Tolinku dashboard to quantify the business impact of your deep links.
For the benefits, see 10 benefits of deep linking for mobile apps. For the complete guide, see the complete guide to deep linking in 2026.
Get deep linking tips in your inbox
One email per week. No spam.