Analytics Dashboard
The analytics dashboard shows how your deep links are performing. Open Analytics in the sidebar to see an overview of clicks, installs, conversions, and traffic patterns for your Appspace.
Overview metrics
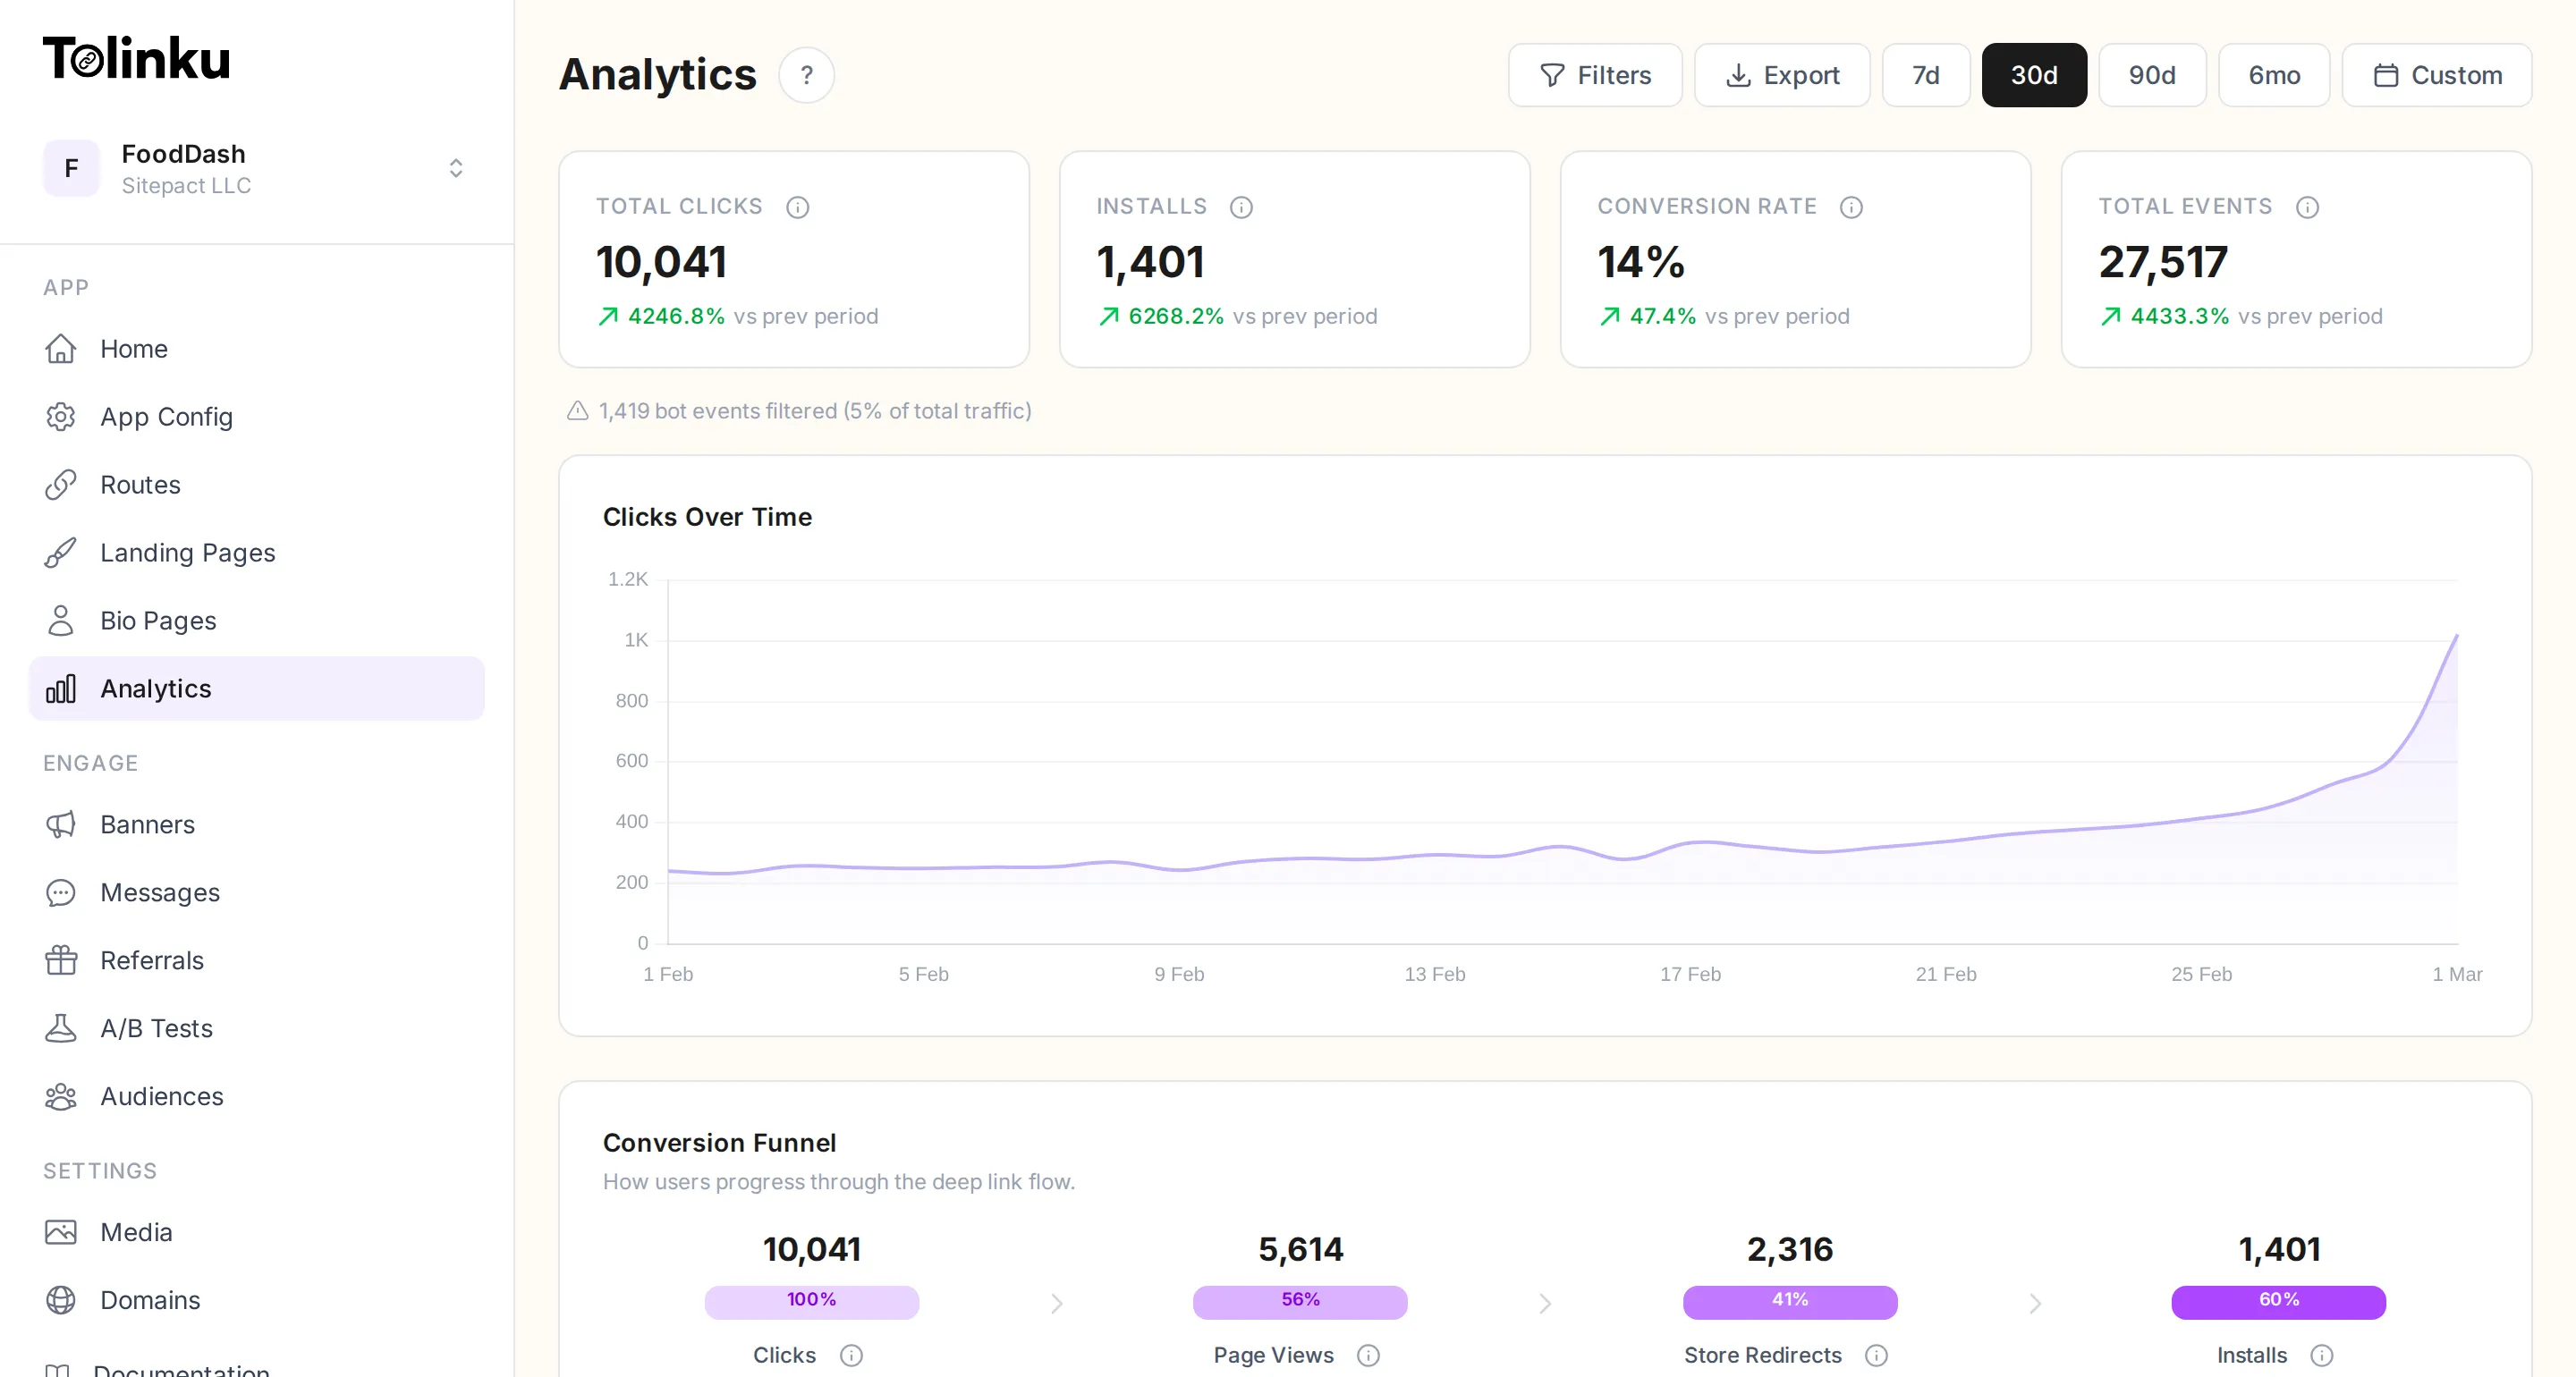
Section titled “Overview metrics”The top of the dashboard shows headline numbers for the selected date range:
- Total clicks: How many times your links were tapped or clicked.
- Installs: App installs tracked by the Tolinku SDK.
- Conversion rate: The percentage of clicks that resulted in an install.
- Total events: The total number of tracked events (clicks, installs, views, and custom events).
Each metric includes a comparison to the previous period so you can see trends at a glance.
Date range
Section titled “Date range”By default, the dashboard shows the last 30 days. You can switch to 7, 90, or 180 days using the preset buttons, or pick a custom date range with the calendar picker.
Bot filtering
Section titled “Bot filtering”Tolinku detects and filters bot traffic automatically. Bot clicks are excluded from all metrics by default. You can configure bot detection rules (user-agent whitelist/blacklist) in Appspace Settings.
What gets tracked
Section titled “What gets tracked”Every time a user interacts with your links, Tolinku records:
- Event type (click, install, landing page view, store redirect, banner click, link open)
- Timestamp
- URL and route prefix
- Device type (mobile, desktop, tablet)
- Operating system and browser
- Country, region, and city (via IP geolocation)
- UTM parameters (campaign, source, medium, term, content)
- Bot detection flag
This data powers the dashboard charts, filters, and CSV exports.
Ecommerce analytics
Section titled “Ecommerce analytics”On paid plans, you can track purchases, revenue, cart activity, and product performance alongside your deep link metrics. Ecommerce data appears in additional tabs on the analytics page: Ecommerce, Attribution, and Cohorts.
See Ecommerce Analytics for setup instructions and a full feature overview.