Revenue attribution answers a simple question: which marketing touchpoint caused the sale? When your campaigns use deep links, every click is a measurable event with metadata (campaign, source, medium, timestamp). But a single customer might interact with three different deep links before purchasing. The attribution model you choose determines how revenue gets assigned across those touchpoints.
Choosing the wrong model can lead you to over-invest in channels that look productive but aren't, or to cut spending on campaigns that are quietly driving conversions. This article covers the three most common attribution models, when each makes sense, and how to configure them for deep link campaigns.
The Attribution Problem
Consider a customer who buys a $120 pair of shoes from your app. Over the past two weeks, they interacted with three of your deep links:
- Day 1: Clicked a deep link in an Instagram ad (landed on the product page in-app)
- Day 8: Clicked a deep link in a promotional email (viewed the same product)
- Day 14: Clicked a deep link from a Google search ad (purchased immediately)
All three touchpoints contributed to the sale. But $120 of revenue needs to be attributed somewhere. The model you pick changes the story your data tells.
Last Click Attribution
Last click gives 100% of the revenue to the final touchpoint before the purchase. In the example above, the Google search ad gets the full $120.
How it works:
- Look at the purchase event
- Find the most recent deep link click within the attribution window
- Assign all revenue to that click's campaign
Revenue split for our example:
| Touchpoint | Revenue (Last Click) |
|---|---|
| Instagram ad | $0 |
| Promotional email | $0 |
| Google search ad | $120 |
When to use last click:
- You want simplicity and a clear, single source of truth per conversion
- Your purchase cycle is short (same-session or same-day purchases)
- You're optimizing for bottom-of-funnel campaigns (search, retargeting)
- You have a small marketing team and need actionable data without complexity
Limitations: Last click ignores everything that happened before the final interaction. It systematically undervalues awareness campaigns and overvalues intent-capture campaigns. If you only use last click, you might cut your Instagram budget because it "never drives sales," when in reality it's filling the top of your funnel.
Linear Attribution
Linear attribution divides revenue equally across all touchpoints. Each deep link click in the customer's journey gets the same share.
Revenue split for our example:
| Touchpoint | Revenue (Linear) |
|---|---|
| Instagram ad | $40 |
| Promotional email | $40 |
| Google search ad | $40 |
When to use linear:
- You want a balanced view of your entire marketing mix
- You're building a multi-channel strategy and need to understand which channels participate in conversions
- Your customer journey involves multiple touchpoints across different campaigns
- You're evaluating new channels and want to see their contribution without the bias of position-based models
Limitations: Linear treats all touchpoints as equally important. A casual impression and a high-intent search click get the same credit. This can dilute the signal from your strongest-performing campaigns.
Time Decay Attribution
Time decay gives more credit to touchpoints closer to the purchase. Interactions that happened recently receive a larger share of revenue, while older touchpoints get less. The decay follows an exponential curve, typically using a configurable half-life.
With a 7-day half-life, a touchpoint from 7 days ago gets half the credit of one from today. A touchpoint from 14 days ago gets a quarter.
Revenue split for our example (7-day half-life):
| Touchpoint | Days Before Purchase | Relative Weight | Revenue |
|---|---|---|---|
| Instagram ad | 13 days | 0.27 | ~$18 |
| Promotional email | 6 days | 0.55 | ~$37 |
| Google search ad | 0 days | 1.00 | ~$65 |
(Weights are normalized so the total equals $120)
When to use time decay:
- Your sales cycle is longer (7+ days between first touch and purchase)
- You want to value recent interactions more without completely ignoring earlier ones
- You're running multi-touch campaigns where awareness, consideration, and conversion happen at different times
- You need a middle ground between last click and linear
Limitations: Time decay still undervalues the first touch. If a customer discovered your brand through a deep link in a blog post three weeks ago, that touchpoint gets minimal credit even though it started the entire journey.
Attribution Windows
The attribution window defines how far back to look for touchpoints. If a customer clicked a deep link 45 days ago and purchases today, should that click get credit?
Common window configurations:
| Window Length | Best For |
|---|---|
| 7 days | Impulse purchases, flash sales, low-value items |
| 14 days | Standard e-commerce (clothing, accessories, electronics under $100) |
| 30 days | Higher-value purchases, considered decisions |
| 60 days | B2B products, luxury goods, high-consideration items |
| 90 days | Enterprise sales, subscription services with long evaluation periods |
Shorter windows produce cleaner attribution but miss longer consideration cycles. Longer windows capture more touchpoints but risk attributing revenue to clicks that had no real influence.
The IAB's measurement guidelines recommend matching your window to your typical sales cycle. Analyze your time-to-purchase distribution: if 90% of customers buy within 14 days of their first interaction, a 30-day window captures the vast majority of legitimate attribution paths.
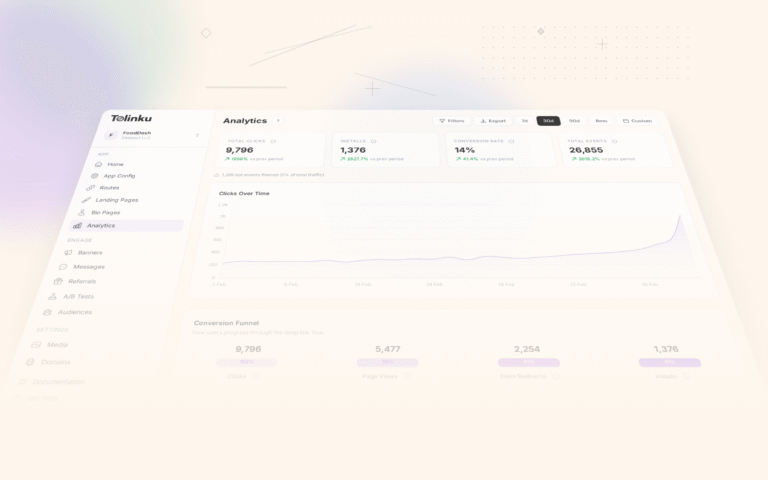
Tolinku supports configurable attribution windows from 7 to 90 days. You can adjust the window per Appspace in Appspace Settings, and the Attribution tab in the analytics dashboard shows how changing the window affects your revenue distribution.
Configuring Attribution in Practice
To get meaningful attribution data, your analytics pipeline needs to capture three things:
- Deep link clicks with campaign metadata (UTM parameters, campaign IDs, source identifiers)
- User identity across sessions (device ID, logged-in user ID, or a combination)
- Purchase events with revenue data (order value, currency, transaction ID)
The Tolinku SDK captures 13 e-commerce event types, including purchase events with revenue, currency (200+ currencies supported), and transaction metadata. When a user clicks a deep link and later makes a purchase, the SDK associates the click with the conversion using the configured attribution model.
Here's what a purchase event looks like:
await tolinku.ecommerce.purchase({
  transaction_id: 'order_12345',
  revenue: 120.00,
  currency: 'USD',
  items: [
    { item_id: 'shoe_456', item_name: 'Running Shoes', price: 120.00, quantity: 1 }
  ]
});
The attribution model then determines how that $120 gets distributed across the deep link clicks in the user's history. You can view the attribution breakdown in the Attribution tab, which shows revenue by campaign, source, and medium under each model.
Comparing Models Side by Side
Run all three models on the same data set to understand how they differ. Here's an example with five campaigns over one month:
| Campaign | Last Click Revenue | Linear Revenue | Time Decay Revenue |
|---|---|---|---|
| Instagram ads | $2,400 | $8,200 | $5,100 |
| Email newsletters | $5,800 | $6,100 | $6,400 |
| Google search ads | $18,500 | $11,300 | $14,800 |
| Referral links | $3,200 | $4,900 | $3,600 |
| Push notifications | $8,100 | $7,500 | $8,100 |
| Total | $38,000 | $38,000 | $38,000 |
The total is always the same. Only the distribution changes. Instagram ads look like a poor performer under last click ($2,400) but a significant contributor under linear ($8,200). Google search ads dominate under last click but share more credit under linear.
The right model depends on your goals. If you're optimizing for immediate ROI, last click gives you the clearest signal. If you're building long-term brand awareness, linear or time decay helps you understand the full picture.
The Cross-Device Attribution Challenge
A customer might discover your product on their desktop, research it on their tablet, and purchase on their phone. Each device generates a separate session, and without a shared identifier, these look like three different users.
Cross-device attribution requires one of:
- Authenticated users: If the customer logs in on each device, you can stitch sessions together using their user ID. This is the most reliable method.
- Probabilistic matching: Using signals like IP address, device fingerprint, and behavioral patterns to infer that sessions belong to the same person. Less accurate, and increasingly constrained by privacy regulations like GDPR and Apple's App Tracking Transparency.
- Deep link passthrough: When a deep link carries a user identifier (e.g., an email click includes a hashed user ID), the receiving app can associate the session with a known user.
The practical impact: if you can't match users across devices, your attribution data will have gaps. Some revenue will appear to come from "direct" or "unattributed" sources when it was actually driven by a campaign on another device.
Handling Unattributed Revenue
Not every purchase can be traced to a deep link click. Users bookmark your app, search for it directly, or return from memory. This "organic" or unattributed revenue typically accounts for 30-60% of total revenue in mature apps.
Don't ignore it. Track the ratio of attributed to unattributed revenue over time. If your marketing campaigns are effective, you should see the attributed percentage grow. If unattributed revenue is increasing while campaign spend stays flat, your brand awareness is working, even if individual campaigns don't get credit.
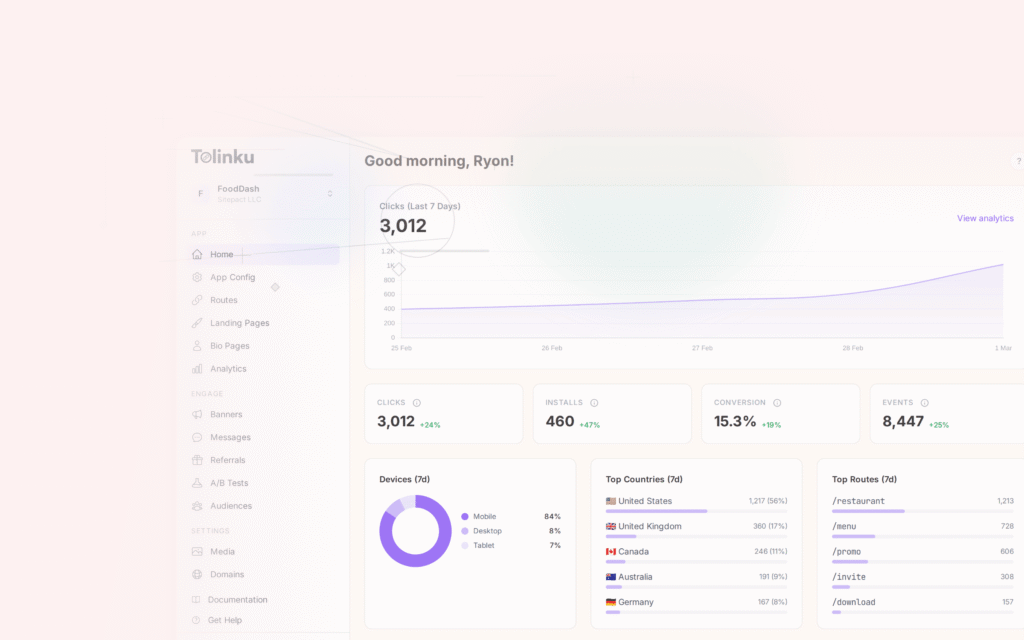
Tolinku's e-commerce analytics dashboard separates attributed and unattributed revenue, so you can track this ratio without manual calculation.
Practical Recommendations
Start with last click if you're new to attribution. It's the easiest to understand and act on. You can always switch later.
Move to time decay once you have multi-touch campaigns running. It gives a more nuanced view without the complexity of position-based models.
Use linear for channel evaluation. When you're testing a new channel (say, TikTok deep links), linear attribution helps you see whether it participates in conversions at all.
Set your attribution window to 2x your median purchase cycle. If most customers buy within 7 days, use a 14-day window. This captures outliers without introducing noise.
Compare models monthly. Run all three on the same data and look for campaigns where the models disagree significantly. Those campaigns deserve deeper investigation.
Track unattributed revenue as a KPI. A healthy ratio is a sign that your overall marketing strategy is working, not just individual campaigns.
What's Next
Attribution is one piece of the e-commerce analytics puzzle. To understand the full customer journey, you also need funnel analysis (where do users drop off?) and cohort analysis (which acquisition months produce the highest lifetime value?). Together, these three analyses give you a complete picture of how your deep link campaigns drive revenue.
Get deep linking tips in your inbox
One email per week. No spam.