Customer Lifetime Value (LTV) tells you how much revenue a customer generates over their entire relationship with your business. Cohort analysis tells you how that value accumulates over time and which acquisition channels produce the most valuable customers. Together, they're the most important tools for deciding where to spend your marketing budget.
Most e-commerce teams track revenue per campaign. Fewer track revenue per customer over months or years. The difference matters. A campaign that acquires customers cheaply but with low retention is less valuable than one that costs more upfront but produces customers who keep buying for years.
What Is Cohort Analysis?
A cohort is a group of users who share a common characteristic, usually their acquisition date. A "January 2026 cohort" includes every customer who made their first purchase in January 2026. You then track that group's behavior over subsequent months.
The power of cohort analysis is that it isolates the variable of time. Instead of looking at your overall revenue (which mixes together customers acquired at different times), you can see exactly how much revenue the January cohort generated in February, March, April, and so on.
This separation matters because it reveals patterns that aggregate metrics hide. Your overall revenue might be growing, but if recent cohorts are generating less revenue per customer than earlier ones, you have a problem that won't show up in top-line numbers until it's too late.
Reading a Cohort Matrix
A cohort matrix (sometimes called a cohort table or retention triangle) is a grid where:
- Rows represent acquisition cohorts (usually months)
- Columns represent time periods after acquisition (Month 0, Month 1, Month 2, etc.)
- Cells contain the metric you're tracking (revenue, number of purchases, or percentage of active users)
Here's an example revenue cohort matrix:
| Cohort | Month 0 | Month 1 | Month 2 | Month 3 | Month 4 | Month 5 |
|---|---|---|---|---|---|---|
| Jan 2026 | $42,000 | $12,600 | $9,200 | $7,800 | $6,500 | $5,900 |
| Feb 2026 | $38,000 | $11,400 | $8,700 | $7,200 | $6,100 | – |
| Mar 2026 | $45,000 | $14,800 | $10,100 | $8,400 | – | – |
| Apr 2026 | $35,000 | $8,750 | $5,600 | – | – | – |
| May 2026 | $41,000 | $10,250 | – | – | – | – |
| Jun 2026 | $39,000 | – | – | – | – | – |
Month 0 is the acquisition month (the revenue from first purchases). Subsequent months show how much that same group of customers spent in later months.
Several things stand out:
- Month 0 is always the highest. First purchases drive the most revenue. The question is how much revenue continues after that.
- Revenue decays but stabilizes. Each cohort generates less revenue over time, but the decline rate slows. This is normal. A subset of customers becomes loyal and keeps purchasing.
- March 2026 looks strong. Its Month 1 revenue ($14,800) is 33% of Month 0, compared to 30% for January and February. Something about the March acquisition campaign produced more engaged customers.
- April 2026 looks weak. Its Month 1 revenue ($8,750) is only 25% of Month 0, and Month 2 dropped to $5,600 (16% of Month 0). This cohort is underperforming. Worth investigating what changed in April's acquisition strategy.
Calculating Average LTV
To calculate LTV from a cohort matrix, sum across the row:
January 2026 cohort LTV (through Month 5): $42,000 + $12,600 + $9,200 + $7,800 + $6,500 + $5,900 = $84,000
If the January cohort included 2,100 customers, the average LTV per customer through Month 5 is: $84,000 / 2,100 = $40.00
But this LTV is still accumulating. The January cohort will continue generating revenue in Month 6, 7, and beyond. To project full LTV, you need to model the decay curve.
A common approach is to fit an exponential decay function to the monthly revenue data and extrapolate. If revenue decreases by approximately 20% each month after stabilization (Months 3+), you can estimate:
- Month 6: $5,900 x 0.80 = $4,720
- Month 7: $4,720 x 0.80 = $3,776
- Month 8: $3,776 x 0.80 = $3,021
Sum the projected values to get an estimated 12-month or 24-month LTV. The Harvard Business Review's guide to customer lifetime value provides a more detailed framework for these projections.
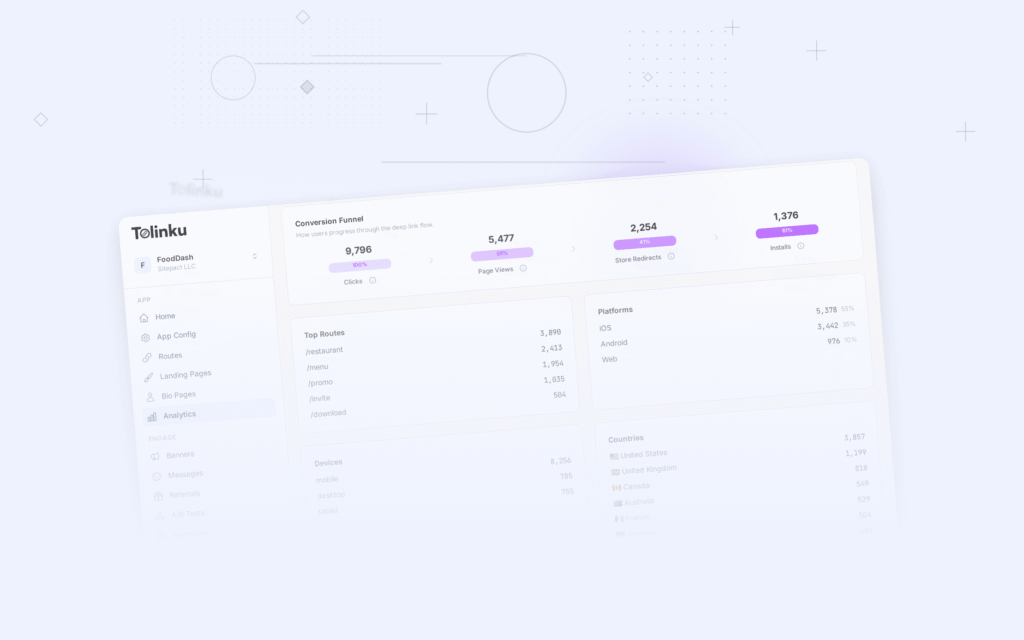
Tolinku's Cohorts tab calculates average LTV automatically, showing both the observed value (from actual data) and a projected value based on the decay pattern of mature cohorts.
Identifying High-Value Acquisition Channels
Cohort analysis becomes especially powerful when you segment by acquisition source. Instead of one cohort per month, create cohorts by channel:
LTV by Acquisition Channel (6-month average):
| Channel | Customers | Avg. First Purchase | 6-Month LTV | LTV:CAC Ratio |
|---|---|---|---|---|
| Email deep links | 1,200 | $45 | $112 | 5.6x |
| Social media ads | 3,400 | $32 | $58 | 1.9x |
| Referral links | 800 | $52 | $134 | 8.9x |
| Search ads | 2,100 | $38 | $72 | 2.4x |
| Push notifications | 1,500 | $41 | $95 | 4.8x |
This table reveals that referral links produce the highest-LTV customers ($134 over 6 months) at the best efficiency (8.9x return on customer acquisition cost). Social media ads bring in the most customers but at the lowest LTV and worst efficiency.
The insight isn't necessarily "stop social ads." Social media might be necessary for brand awareness, and those users might refer others. But it does tell you where to invest marginal dollars: referral programs and email campaigns produce more long-term value per customer.
Deep links are central to this analysis because they carry the campaign metadata that lets you trace each customer back to their acquisition source. Without deep link attribution, you're estimating channel performance. With it, you're measuring it directly.
How Tolinku's Cohorts Tab Works
Tolinku's e-commerce analytics include a dedicated Cohorts tab that builds these matrices automatically from your event data. Here's what it provides:
Cohort grouping options:
- By acquisition month (default)
- By acquisition week (for more granular analysis)
- By campaign or source (to compare channels)
Metrics per cell:
- Revenue (total and per-user average)
- Number of purchases
- Number of active users (retention rate)
Visual display:
- Heat map coloring (darker cells = higher values)
- Percentage view (each cell as a percentage of Month 0)
- Cumulative view (running total across the row)
The SDK's 13 e-commerce event types feed directly into cohort calculations. When a user who was acquired via a deep link campaign makes a purchase three months later, that revenue automatically appears in the correct cohort cell.
Using Cohort Data to Optimize Marketing Spend
Step 1: Calculate LTV by channel
Use your cohort matrix to determine the 6-month or 12-month LTV for each acquisition channel. If a channel is too new to have 12 months of data, use the decay pattern from older cohorts to project.
Step 2: Compare LTV to Customer Acquisition Cost (CAC)
A healthy LTV:CAC ratio depends on your business model, but most e-commerce companies target at least 3:1. Below that, you're spending too much to acquire customers relative to their value. Above 5:1, you might be under-investing in growth.
ProfitWell's SaaS benchmarks suggest 3:1 as a minimum, though e-commerce ratios vary by category.
Step 3: Reallocate budget to high-LTV channels
If email deep links produce 5.6x LTV:CAC and social ads produce 1.9x, shifting budget from social to email should improve overall ROI. But do it gradually and monitor whether the higher spend degrades the channel's efficiency.
Step 4: Investigate underperforming cohorts
When a specific month's cohort underperforms, dig into what changed:
- Did you run a different type of promotion that attracted deal-seekers?
- Did a new campaign source bring in lower-quality traffic?
- Was there a product issue or app bug that hurt the post-purchase experience?
Step 5: Set LTV-based bidding targets
If you know that customers from Google search deep links have a 12-month LTV of $72, you can set your maximum CPC or CPA accordingly. If your target LTV:CAC ratio is 3:1, your maximum CAC is $24. Work backward from that to determine your bid ceiling.
Comparing Channel LTV: Email vs. Social vs. Referral
Let's look at how three common deep link channels typically differ in LTV patterns.
Email deep links tend to produce customers with moderate first-purchase values but strong retention. Email subscribers are already engaged with your brand. They opted in. Their repeat purchase rates are typically 40-60% higher than customers from paid channels.
Social media deep links bring in impulse buyers. First-purchase values are often lower, and the retention curve drops steeply after Month 0. However, social customers may drive awareness through their own networks, creating indirect value that doesn't appear in the cohort matrix.
Referral deep links consistently produce the highest-LTV customers. Referred customers arrive with a trust signal from someone they know. Wharton research found that referred customers have 16% higher LTV than non-referred customers and are 18% less likely to churn.
The cohort matrix makes these patterns visible. Without it, you're relying on first-purchase revenue to evaluate channels, which systematically overvalues social (high volume, low retention) and undervalues referral (lower volume, high retention).
Common Mistakes in Cohort Analysis
Using too short a time horizon. A 3-month LTV comparison might show two channels as equivalent, while a 12-month comparison reveals one is significantly better. Wait for cohorts to mature before making major budget decisions.
Ignoring cohort size. A cohort of 50 customers with $150 LTV is less reliable than a cohort of 5,000 with $80 LTV. Small cohorts have high variance. Make sure you have statistical significance before acting on the data.
Not accounting for seasonality. A December cohort will naturally have a higher Month 0 revenue due to holiday shopping. Compare December to the previous December, not to November or January.
Mixing organic and paid users. If your cohort includes both users who found you organically and users from paid campaigns, the organic users will inflate the LTV numbers. Segment them separately.
Forgetting currency differences. If you operate internationally, your cohort matrix needs to normalize revenue to a single currency. Tolinku supports 200+ currencies in its e-commerce events and handles conversion automatically in the analytics dashboard.
From Cohort Data to Action
Cohort analysis isn't a one-time exercise. Build it into your monthly review process:
- Monthly: Review the latest cohort data. How does last month's cohort compare to the same month last year? How does it compare to the previous month?
- Quarterly: Recalculate LTV by channel. Has the LTV:CAC ratio changed for any channel? Do you need to reallocate budget?
- Annually: Review your LTV projections against actual data. How accurate were your decay curve models? Adjust the models based on real data.
The goal is to continuously improve the quality of customers you acquire, not just the quantity. Cohort analysis, powered by deep link attribution data from tools like Tolinku's e-commerce analytics suite, gives you the visibility to do that systematically.
Get deep linking tips in your inbox
One email per week. No spam.