A smart banner that runs without analytics is a guess. You do not know how many users saw it, how many tapped it, how many installed the app as a result, or whether those installs led to any revenue. Without that data, you are optimizing nothing.
This guide covers the full measurement stack for smart banners: what to track, how each metric is calculated, where attribution gets complicated, and how to use the Tolinku analytics dashboard to answer the questions that actually matter.
The Measurement Funnel
Smart banner analytics follows a funnel structure. Each stage narrows as users drop off:
- Page views with banner eligibility: Total mobile page views where the banner was eligible to show (based on targeting rules)
- Impressions: Banner was actually rendered and visible to the user
- Clicks (CTA taps): User tapped the CTA button
- Store page visits: User arrived at the App Store or Google Play page
- Installs: User completed the install
- First app sessions: User opened the app for the first time
- Retained users: User returned to the app within 7 or 30 days
Not every step is equally easy to measure. Impressions and clicks are straightforward. The store-to-install gap is where attribution gets difficult.
Tracking Impressions
An impression should be recorded when the banner is visible to the user, not just when the HTML element exists in the DOM. A banner that renders off-screen or is immediately hidden by other content is not a real impression.
Use the Intersection Observer API to detect when the banner enters the viewport:
const banner = document.getElementById('tolk-banner');

const observer = new IntersectionObserver(
  (entries) => {
    entries.forEach((entry) => {
      if (entry.isIntersecting && entry.intersectionRatio >= 0.5) {
        recordImpression();
        observer.unobserve(banner); // Record once per page view
      }
    });
  },
  { threshold: 0.5 }
);

observer.observe(banner);

function recordImpression() {
  // Send to your analytics endpoint
  navigator.sendBeacon('/api/banner/impression', JSON.stringify({
    bannerId: 'summer-promo-ios',
    pageUrl: window.location.pathname,
    timestamp: Date.now(),
  }));
}
The threshold: 0.5 setting means the banner must be at least 50% visible before an impression is recorded. This prevents counting impressions from banners that appear briefly during scroll.
navigator.sendBeacon is preferred over fetch for analytics events because it fires reliably even if the user navigates away from the page immediately after the impression. The Beacon API is designed specifically for this use case.
Click-Through Rate (CTR)
CTR is the percentage of impressions that result in a CTA tap:
CTR = (Clicks / Impressions) × 100
A typical smart banner CTR ranges from 3% to 12% depending on the app category, audience targeting, and banner design. E-commerce and utility apps with strong value propositions tend toward the higher end. Informational or content apps tend toward the lower end.
Tracking clicks:
const ctaButton = document.getElementById('tolk-banner-link');

ctaButton.addEventListener('click', (event) => {
  navigator.sendBeacon('/api/banner/click', JSON.stringify({
    bannerId: 'summer-promo-ios',
    pageUrl: window.location.pathname,
    destination: ctaButton.href,
    timestamp: Date.now(),
  }));
  // Let the default navigation proceed
});
Record clicks before navigation, not after. If you rely on the destination page to send the click event back, you lose data from users who close the store page immediately.
Install Attribution: The Hard Part
Measuring installs from banner clicks is harder than measuring impressions and clicks. The gap between tapping your banner and completing an install crosses two different systems: your web server and the app store.
How Mobile Attribution Works
When a user taps your banner:
- They arrive at the App Store or Google Play (or open the app directly if already installed)
- If they install and open the app, your app needs to report back to your attribution system
The standard approach is deferred deep linking. When the user taps the banner:
- A tracking link is generated with a unique click ID
- That click ID is stored (in a fingerprint or a cookie-based attribution window)
- When the app is installed and opened, the SDK retrieves the stored attribution data and reports the install back to the attribution platform
Apple's SKAdNetwork is the privacy-preserving attribution system for iOS. It does not give you individual-level install data; instead, it reports aggregated conversion values with a delay of up to 24-48 hours. This is the reality post-iOS 14.5.
On Android, the Google Play Install Referrer API lets you pass a referrer string through the install process. When the app first opens, it can read the referrer and attribute the install to the correct campaign.
Tolinku handles both attribution paths automatically. The deep linking features page explains how the attribution chain is preserved across the install gap.
Attribution Windows
An attribution window defines how long after a banner click an install can be credited to that click. Common windows:
- 1-day click-through: Conservative. Only credits installs that happen within 24 hours of the tap.
- 7-day click-through: Standard for most mobile campaigns.
- 30-day click-through: Used for apps with longer consideration cycles (finance, B2B).
Longer windows capture more installs but increase the risk of false attribution: a user who tapped your banner two weeks ago and installed today because of an entirely different reason.
Match your attribution window to your app's typical decision cycle. If users typically install within a few hours of tapping a banner, a 7-day window adds noise without value.
Calculating Revenue Impact
Click-through rate and installs are leading indicators. Revenue impact is the metric that justifies the investment.
To calculate banner-attributed revenue:
Banner-attributed revenue = (Installs from banner) × (Average revenue per installing user)
"Average revenue per installing user" is calculated from your cohort data: take users who installed via banner in a given period, track their in-app purchases or subscriptions over 30, 60, or 90 days, and divide by the cohort size.
This requires connecting your banner attribution data to your in-app revenue data. Tolinku's analytics system passes attribution parameters into the first app session, where your app's analytics SDK (Mixpanel, Amplitude, or similar) can associate them with user revenue events.
The Tolinku Analytics Dashboard
The Tolinku analytics dashboard provides a unified view of banner performance across all your configured banners.
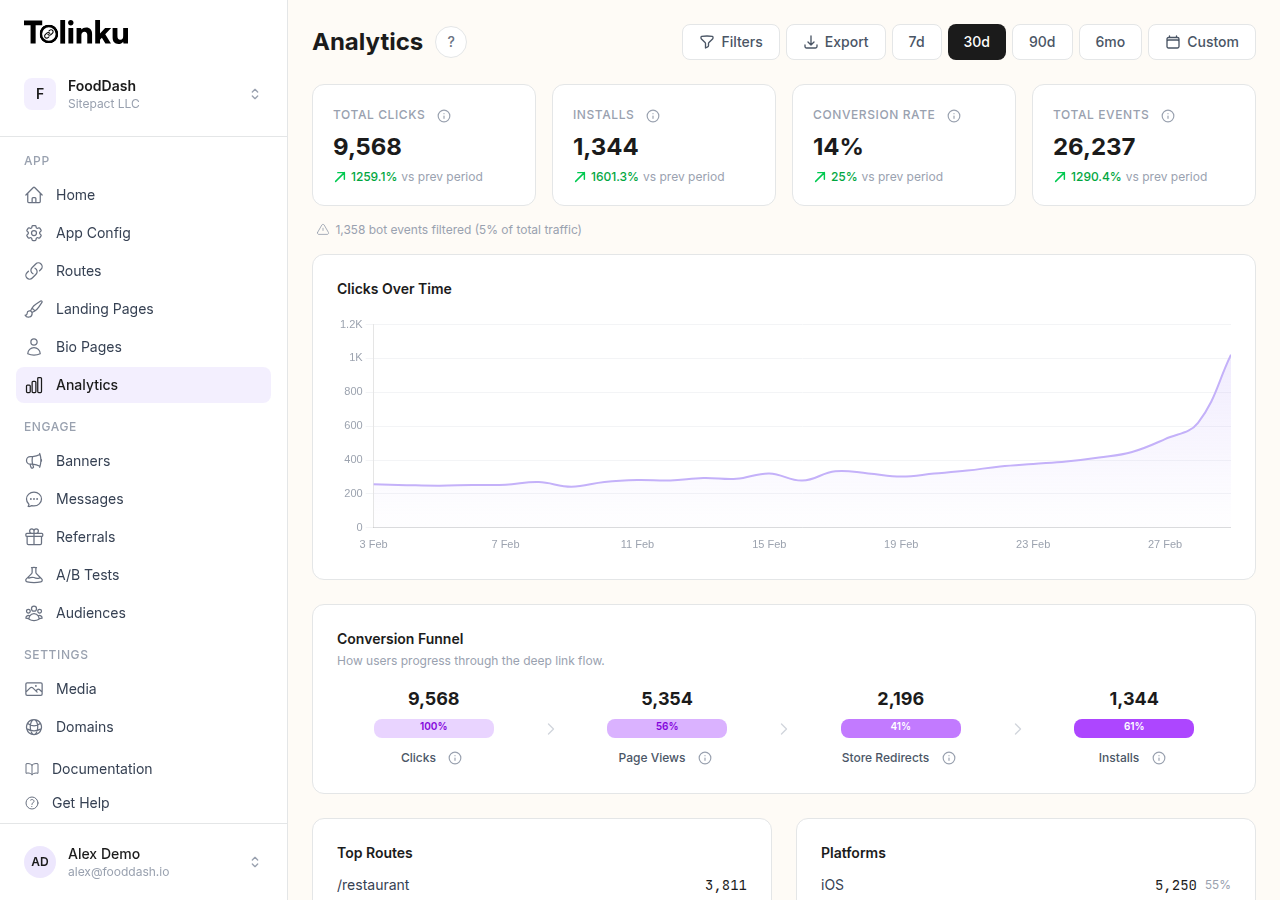
Key views:
Banner summary: Impressions, clicks, and CTR for each banner over a selected time range. Sortable by any metric. Good for identifying which banners need attention.
Funnel view: Tracks the full journey from impression to install for each banner. Shows where users drop off. If your click-to-install rate is low, the problem is in the store page experience or the app onboarding, not the banner.
Segment breakdown: Filter any metric by OS, browser, device type, or traffic source. Reveals if a banner performs well on iOS but poorly on Android, or well on Safari but poorly in Chrome.
Time series: Plot any metric over time to spot trends. Useful for seeing if a banner is experiencing fatigue (declining CTR over time, which indicates the audience has become oversaturated).
A/B test results: If you are running a test through Tolinku's A/B testing feature, the dashboard shows variant performance alongside statistical confidence. You do not need to export data to a spreadsheet to check significance.
Diagnosing Performance Problems
When banner metrics are below expectations, the analytics data points to the cause:
Low impression rate (impressions / eligible page views): The banner is not rendering or is being hidden. Check for CSS conflicts, slow load times, or targeting rules that are more restrictive than intended.
Low CTR: Users are seeing the banner but not tapping it. This is a design or copy problem. Run an A/B test on the CTA copy and button color. See the banner design best practices guide.
High CTR, low install rate: Users are tapping but not installing. This might be a store page problem (poor app store listing, low ratings), a platform mismatch (sending iOS users to the wrong URL), or a deep link error that drops users at a confusing state.
High install rate, low retention: The banner is attracting installs but the users are not engaging with the app. The banner's promise does not match the app's actual experience. Align the banner copy more closely with what users encounter on first launch.
Reporting Banner Performance to Stakeholders
When presenting banner performance to non-technical stakeholders, focus on three numbers:
- Installs attributed to banners in the reporting period
- Cost per install (if you are paying for traffic that sees the banner)
- Revenue attributed to banner-acquired users over a standard cohort window (30 or 90 days)
Compare these to your other acquisition channels (paid social, paid search, email) on the same metrics. This framing makes the value of the banner investment legible in terms that marketing and finance teams already understand.
The Tolinku analytics and deep link analytics guide provide the data infrastructure to support this kind of cross-channel comparison.
Get deep linking tips in your inbox
One email per week. No spam.