A/B testing seems straightforward: split traffic, pick the winner, ship it. In practice, most teams make mistakes that quietly invalidate their results. They end up deploying changes based on noise, missing real improvements, or wasting months of traffic on tests that were doomed from the start.
These 10 mistakes are the ones we see most often. Each one is fixable, and avoiding them will dramatically improve the quality of your experimentation program.
For a full guide on testing deep links and landing pages, see A/B Testing Deep Links and Landing Pages.
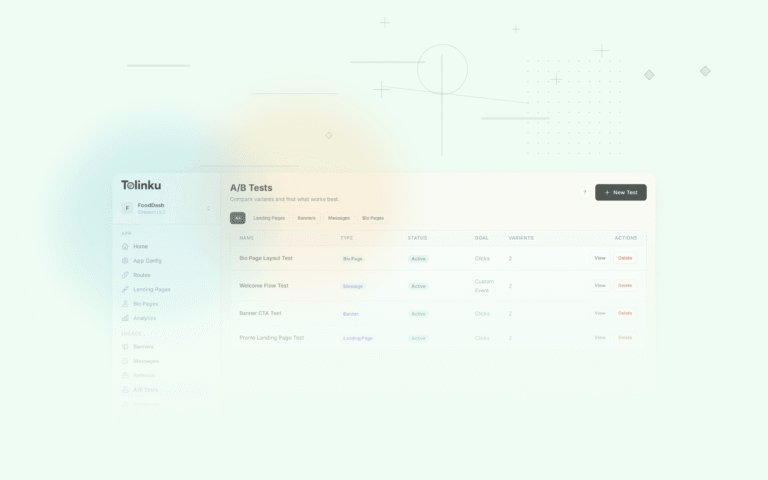
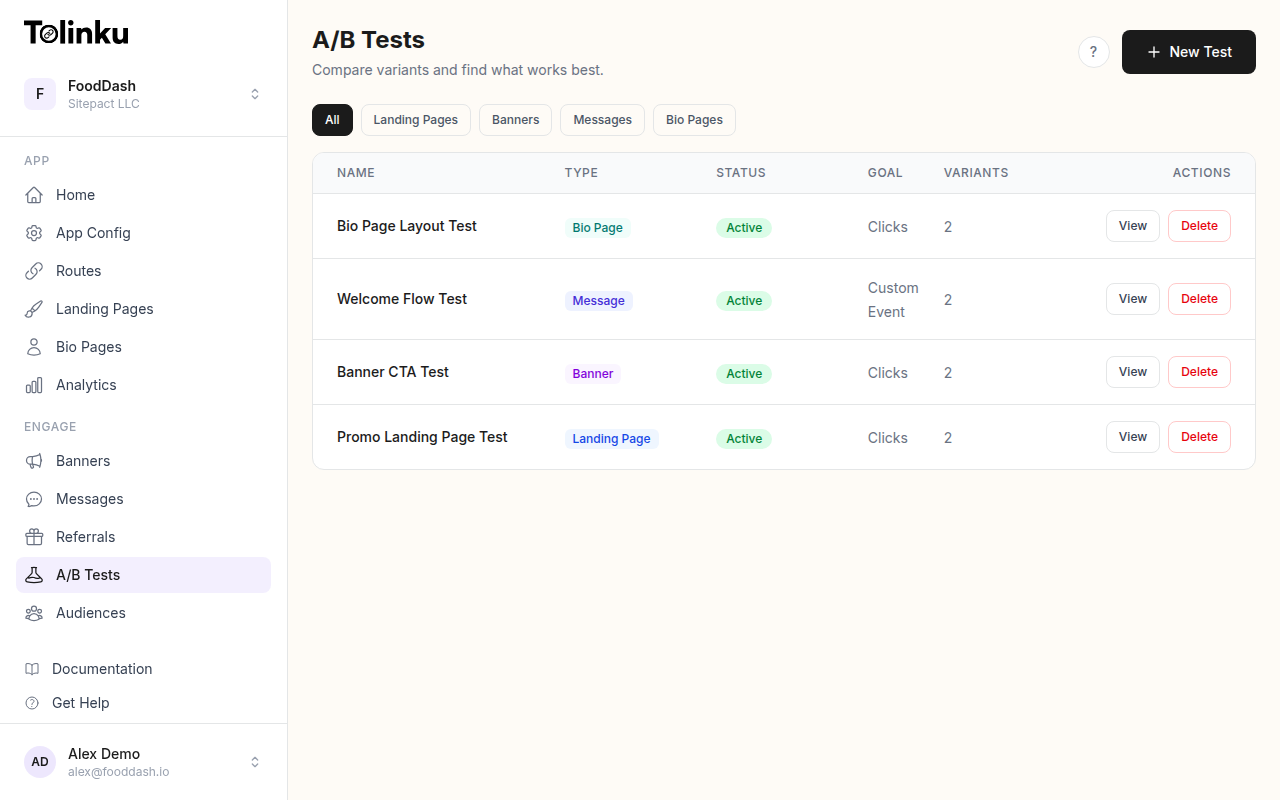 The A/B tests list page showing test names, status, types, and variant counts.
1. Stopping Tests Too Early
This is the most common A/B testing mistake, and the most damaging. You launch a test, see Variant B pulling ahead after a day or two, and call it. The problem is that early results are unreliable. Small sample sizes produce wild swings that disappear once more data comes in.
Why it's bad: Early stopping inflates your false positive rate. A test designed for 95% confidence can effectively operate at 50% confidence or worse if you peek at results and stop when they look good. You'll "validate" changes that have zero real effect.
How to fix it: Calculate your required sample size before launching the test. Commit to running the test until you reach that number. If you want the flexibility to stop early, use sequential testing methods that adjust for multiple looks at the data.
// Bad: checking results daily and stopping on first significant result
if (pValue < 0.05) {
  stopTest(); // Might be day 2 of a test that needs 14 days
}

// Better: pre-commit to a fixed sample size
const REQUIRED_SAMPLE = 5000; // per variant
if (totalVisitors >= REQUIRED_SAMPLE * numberOfVariants) {
  analyzeResults();
}
2. Not Calculating Sample Size in Advance
Many teams launch A/B tests with no idea how much traffic they need. They run the test "for a week or two" and check the results. This leads to underpowered tests that can't detect real differences, or overpowered tests that waste traffic you could have used elsewhere.
Why it's bad: Without a sample size calculation, you don't know whether your test can actually detect the effect you care about. A 2% improvement in conversion rate requires far more traffic to detect than a 20% improvement. If your test is underpowered, you'll conclude "no difference" when a meaningful difference exists.
How to fix it: Use a sample size calculator before every test. You need three inputs: your baseline conversion rate, the minimum detectable effect (the smallest improvement worth knowing about), and your desired statistical power (typically 80%).
For the full formula and calculator, see A/B Testing Sample Size Calculator.
3. Testing Too Many Variables at Once
Changing the headline, CTA button color, page layout, and copy all in a single variant makes it impossible to know which change caused the result. If Variant B wins, was it the headline or the button color? If it loses, did one great change get dragged down by a bad one?
Why it's bad: You can't learn from the test. The whole point of A/B testing is to isolate variables and understand cause and effect. Bundling changes together gives you a result with no explanation.
How to fix it: Test one variable at a time. If you need to test multiple variables simultaneously, use multivariate testing (MVT), which is designed to measure the impact of each variable independently. For deep link tests, this means changing only the destination, only the fallback page, or only the CTA copy, not all three.
# Good: isolated tests
Test 1: Deep link -> product page vs. deep link -> category page
Test 2: CTA "Open in App" vs. CTA "View Deal"
Test 3: Landing page with video vs. landing page with static image

# Bad: bundled changes
Variant A: product page + "Open in App" + video
Variant B: category page + "View Deal" + static image
4. Ignoring User Segments
Your test shows a 5% lift overall. You ship it. But the lift came entirely from Android users, while iOS users actually experienced a 3% drop. Averaging across segments hides these differences, and you end up hurting part of your audience.
Why it's bad: Aggregate results mask segment-level effects. A change that helps one group and hurts another can show as neutral or slightly positive in the overall numbers. This is a form of Simpson's paradox, where combined data suggests a different conclusion than segmented data.
How to fix it: Always break down results by key segments: platform (iOS vs. Android), traffic source (organic vs. paid vs. email), device type, geography, and new vs. returning users. Tolinku's analytics let you segment test results by these dimensions automatically. If a variant wins in one segment but loses in another, consider deploying different experiences per segment rather than picking a single winner.
5. Optimizing for the Wrong Metric
A new landing page increases app installs by 15%. Success? Not if those extra installs come from users who open the app once and never return. Optimizing for a vanity metric (clicks, installs, page views) instead of a meaningful business metric (activation, retention, revenue) leads to decisions that look good on a dashboard but don't move the business forward.
Why it's bad: You'll optimize your way into a local maximum that doesn't align with your actual goals. Deep link click-through rate is easy to measure but tells you nothing about what happens after the click. A link with a lower CTR but higher downstream conversion can generate more revenue.
How to fix it: Define your primary metric before launching the test, and make sure it's as close to your business goal as possible. For deep link experiments, consider these metrics in order of value:
- Revenue per visitor (best, but needs the most data)
- Activation rate (user completes a key action after arriving)
- Conversion rate (user completes the funnel)
- Click-through rate (easiest to measure, least informative)
Track secondary metrics too, but make decisions based on the primary one.
6. Not Tracking the Full Funnel
You're A/B testing which deep link destination converts better, but you're only measuring clicks. You have no idea what happens between the click and the final conversion. Did users bounce from the landing page? Did they start the sign-up flow and abandon it? Without full-funnel tracking, you're optimizing a single step while ignoring everything else.
Why it's bad: Improving one step can harm the next. A more aggressive CTA might get more clicks but attract less qualified users who drop off later. If you only measure clicks, you'll think the aggressive CTA is winning.
How to fix it: Instrument every step of the funnel: click, landing page view, app open (or install), key action, and conversion. Tolinku's A/B testing tracks events across the full deep link journey, from click through app open to downstream conversion.
// Track the full funnel, not just the first step
const funnelSteps = [
  'link_click',
  'landing_page_view',
  'app_install',       // or app_open for existing users
  'signup_started',
  'signup_completed',
  'first_purchase'
];

// Analyze conversion rates between each step
funnelSteps.forEach((step, i) => {
  if (i > 0) {
    const dropoff = 1 - (counts[step] / counts[funnelSteps[i - 1]]);
    console.log(`${funnelSteps[i - 1]} -> ${step}: ${(dropoff * 100).toFixed(1)}% drop-off`);
  }
});
7. Running Tests During Anomalies
You launch an A/B test on Black Friday, during a viral marketing moment, or right after a major app update. The traffic patterns, user behavior, and conversion rates during these periods are not representative of normal conditions. Any results you get will reflect the anomaly, not the change you're testing.
Why it's bad: Results from anomalous periods don't generalize. A landing page that works during a sale (when users have high purchase intent) may not work during normal traffic. Seasonal effects, marketing pushes, and product changes all create noise that can overwhelm the signal from your test.
How to fix it: Avoid launching tests during known anomalies (holidays, sales events, product launches). If you must test during these periods, plan to re-validate the results under normal conditions. Check your traffic sources and volumes before and during the test to confirm they're stable. Most reliable tests run for at least one full week to capture day-of-week effects, and ideally two weeks to smooth out variability.
8. Not Documenting Results
Your team ran 30 A/B tests last year. How many of them can you reference today? If the results live in someone's Slack messages or a forgotten spreadsheet, they're effectively lost. New team members will re-run the same tests. Old mistakes will be repeated.
Why it's bad: Undocumented tests waste future effort. Every test produces knowledge, even the ones that show no difference. Without a record of what was tested, what the hypothesis was, and what happened, your team can't build on previous work. You also lose the ability to spot patterns across tests (for example, that CTA copy changes consistently outperform layout changes).
How to fix it: Create a simple test log. For each test, record:
- Hypothesis: what you expected and why
- Variants: what changed between control and treatment
- Metric: what you measured
- Sample size: how much traffic each variant received
- Result: the numbers, confidence level, and your decision
- Learnings: what you took away from the test
A shared spreadsheet or wiki page works fine. The format matters less than the habit of recording every test.
9. Ignoring Statistical Significance
A variant is "up 8%" but the confidence level is 72%. The team ships it because 8% sounds good. The problem is that at 72% confidence, there's roughly a 28% chance the difference is just noise. You could easily be shipping a change that has no effect, or even a negative one.
Why it's bad: Without statistical significance, you're making decisions based on randomness. The standard threshold for significance is 95% confidence (p < 0.05), meaning there's less than a 5% chance the result is due to chance alone. Anything below that threshold should not be acted on as if it were a real finding.
How to fix it: Set your significance threshold before the test begins (typically 95%). Do not lower it after the fact to make a result "significant." If your test ends without reaching significance, the correct conclusion is "inconclusive," not "no effect." You may need more traffic, a larger effect size, or a different test design.
function isSignificant(conversionA, sampleA, conversionB, sampleB, alpha = 0.05) {
  const rateA = conversionA / sampleA;
  const rateB = conversionB / sampleB;

  const pooledRate = (conversionA + conversionB) / (sampleA + sampleB);
  const standardError = Math.sqrt(
    pooledRate * (1 - pooledRate) * (1 / sampleA + 1 / sampleB)
  );

  const zScore = (rateB - rateA) / standardError;
  const pValue = 2 * (1 - normalCDF(Math.abs(zScore)));

  return {
    significant: pValue < alpha,
    pValue: pValue.toFixed(4),
    lift: ((rateB - rateA) / rateA * 100).toFixed(2) + '%'
  };
}
For a deeper explanation, see Statistical Significance for A/B Tests.
10. Testing Low-Impact Elements
You spent two weeks testing whether the CTA button should be green or blue. The result was inconclusive because the difference, if it exists at all, is too small to detect with your traffic. Meanwhile, you could have tested whether sending users to a product page versus a category page improves conversion by 30%.
Why it's bad: Testing low-impact elements wastes your most scarce resource: traffic. Every visitor assigned to a low-impact test is a visitor not assigned to a high-impact one. Button colors, minor copy tweaks, and icon changes rarely produce measurable effects. Structural changes (different destinations, different flows, different offers) almost always produce larger effects that are easier to detect.
How to fix it: Prioritize tests by expected impact. A useful framework:
- High impact: What the user sees (destination, content, offer, pricing)
- Medium impact: How it's presented (page layout, CTA copy, form design)
- Low impact: How it looks (colors, fonts, icon styles, minor spacing)
Start at the top. Don't test colors until you've exhausted the structural questions. For deep link experiments, test destinations and fallback strategies before testing button styles on the landing page.
Putting It All Together
Good A/B testing is a discipline, not a feature. The tools matter less than the process. Before your next test, run through this checklist:
- Calculated sample size based on baseline rate and minimum detectable effect
- Testing a single variable (or using proper MVT design)
- Primary metric is tied to a real business outcome
- Full funnel is instrumented, not just the first click
- No known anomalies during the test period
- Committed to running until the required sample size is reached
- Significance threshold set at 95% before the test starts
- Segment analysis planned (platform, source, geography)
- Results will be documented regardless of outcome
- Test targets a high-impact variable
Tolinku's A/B testing handles traffic splitting, event tracking, and statistical analysis for deep link experiments. It won't prevent you from making every mistake on this list, but it makes the right practices easier to follow.
For more on A/B testing methodology, see A/B Testing Deep Links and Landing Pages, Statistical Significance for A/B Tests, and A/B Testing Sample Size Calculator.
Get deep linking tips in your inbox
One email per week. No spam.