You've set up a deep link A/B test comparing two landing pages. After three days, variant B is converting 18% better. Should you stop the test and ship it?
With a fixed-horizon test, the answer is no. You committed to a sample size upfront, and stopping early inflates your false positive rate. But what if you could monitor results continuously, stop as soon as you have enough evidence, and still maintain statistical validity? That's exactly what sequential testing provides.
For background on designing A/B tests for deep links, see A/B Testing Deep Links and Landing Pages.
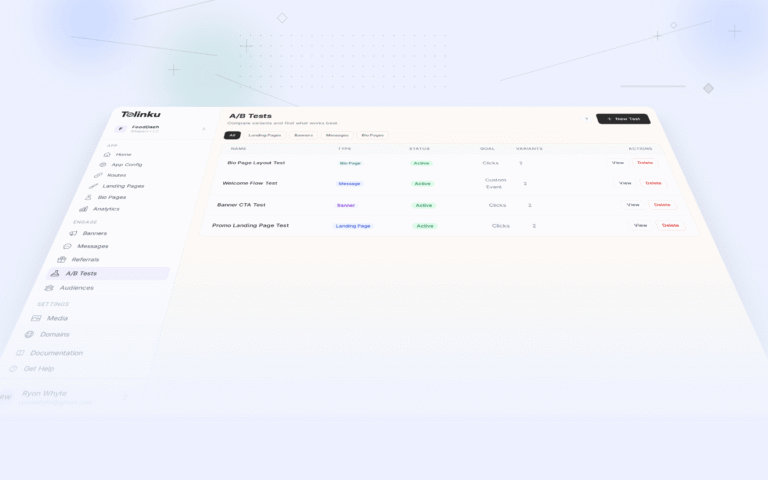
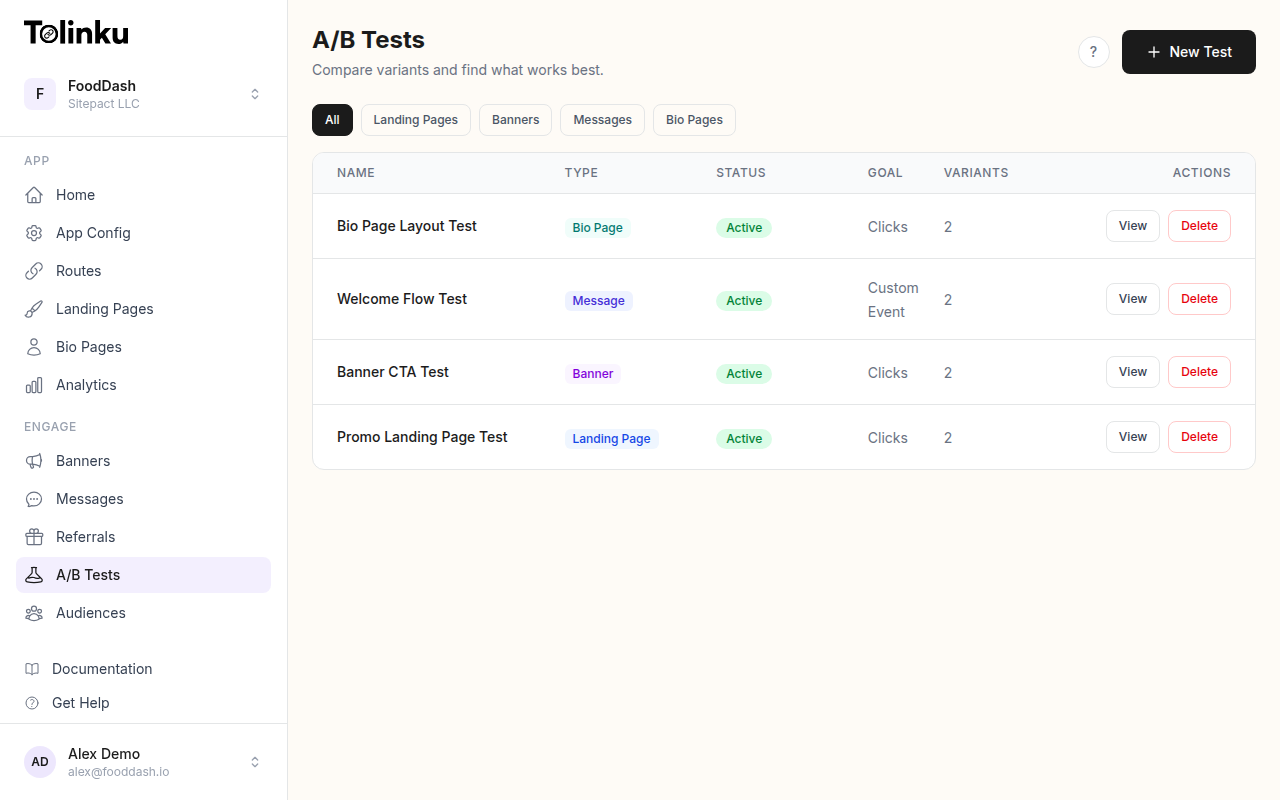 The A/B tests list page showing test names, status, types, and variant counts.
Fixed-Horizon vs. Sequential Testing
In a fixed-horizon test, you calculate a required sample size before starting, run the experiment until you reach it, then analyze the results once. It works, but it has a significant drawback: you cannot peek at the data. Every interim check inflates your Type I error rate (false positives). Checking a fixed-horizon test 5 times during the experiment can push your actual false positive rate from 5% to over 25%.
Sequential testing solves this by building interim analysis directly into the statistical framework. You define a set of checkpoints (or continuously monitor) and use adjusted significance thresholds at each look. The total Type I error across all analyses stays at your target level (typically 5%).
This matters for deep link experiments because:
- Traffic is variable. Deep link campaigns spike during promotions and drop off between them. Waiting for a fixed sample size can take weeks during low-traffic periods.
- Opportunity cost is real. If variant B is genuinely 30% better, running the losing variant for two more weeks costs conversions.
- Multiple campaigns run in parallel. Faster decisions free up testing capacity for the next experiment.
How Alpha Spending Functions Work
Sequential testing uses alpha spending functions to distribute the total allowable Type I error across multiple interim analyses. Instead of spending all 0.05 at one final look, you "spend" portions of alpha at each checkpoint.
Two spending functions dominate in practice:
O'Brien-Fleming
Conservative early, aggressive late. O'Brien-Fleming uses very strict thresholds for early looks and gradually relaxes them as the experiment approaches the target sample size. This makes it nearly impossible to stop very early (which is appropriate since early data is noisy), but barely penalizes you at the final analysis.
Pocock
Equal thresholds at every look. Pocock uses the same adjusted significance level at each interim analysis. This makes early stopping easier but uses a stricter threshold at the final analysis compared to a fixed-horizon test.
| Spending Function | Early Stopping | Final Analysis Threshold | Best For |
|---|---|---|---|
| O'Brien-Fleming | Hard (strict thresholds) | ~0.048 (nearly unchanged) | Large effects, patient teams |
| Pocock | Easier (uniform thresholds) | ~0.031 (stricter) | Time-sensitive decisions |
For most deep link experiments, O'Brien-Fleming is the better default. You get the option to stop early for truly dramatic effects while preserving almost full power at the final analysis.
Implementing Sequential Testing in JavaScript
Here's a practical implementation of a group sequential design with an O'Brien-Fleming spending function.
/**
 * O'Brien-Fleming alpha spending function.
 * Returns cumulative alpha spent at fraction t of the max sample size.
 */
function obrienFlemingSpend(t, alphaTotal = 0.05) {
  // Approximation: alpha(t) = 2 - 2 * Phi(z_{alpha/2} / sqrt(t))
  const z = getZScore(1 - alphaTotal / 2);
  const adjusted = z / Math.sqrt(t);
  return 2 * (1 - normalCDF(adjusted));
}

/**
 * Pocock alpha spending function.
 * Returns cumulative alpha spent at fraction t.
 */
function pocockSpend(t, alphaTotal = 0.05) {
  return alphaTotal * Math.log(1 + (Math.E - 1) * t);
}

/**
 * Standard normal CDF approximation (Abramowitz and Stegun).
 */
function normalCDF(x) {
  const a1 = 0.254829592, a2 = -0.284496736, a3 = 1.421413741;
  const a4 = -1.453152027, a5 = 1.061405429, p = 0.3275911;
  const sign = x < 0 ? -1 : 1;
  x = Math.abs(x) / Math.SQRT2;
  const t = 1.0 / (1.0 + p * x);
  const y = 1 - (((((a5 * t + a4) * t) + a3) * t + a2) * t + a1) * t * Math.exp(-x * x);
  return 0.5 * (1 + sign * y);
}

function getZScore(percentile) {
  if (percentile === 0.975) return 1.96;
  if (percentile === 0.995) return 2.576;
  return 1.96;
}
Setting Up a Group Sequential Experiment
Define interim analysis checkpoints and calculate the boundary z-scores at each look:
function createSequentialExperiment({
  maxSamplePerVariant,
  numLooks,
  alphaTotal = 0.05,
  spendingFunction = 'obrien-fleming',
}) {
  const spend = spendingFunction === 'pocock' ? pocockSpend : obrienFlemingSpend;
  const fractions = Array.from(
    { length: numLooks },
    (_, i) => (i + 1) / numLooks
  );

  let prevAlpha = 0;
  const boundaries = fractions.map((t) => {
    const cumulativeAlpha = spend(t, alphaTotal);
    const incrementalAlpha = cumulativeAlpha - prevAlpha;
    prevAlpha = cumulativeAlpha;

    // Convert incremental alpha to a z-score boundary (two-sided)
    const zBoundary = inverseCDF(1 - incrementalAlpha / 2);
    const sampleAtLook = Math.ceil(maxSamplePerVariant * t);

    return { fraction: t, sampleAtLook, zBoundary, incrementalAlpha };
  });

  return { maxSamplePerVariant, boundaries, alphaTotal, spendingFunction };
}

function inverseCDF(p) {
  // Rational approximation for the inverse normal CDF
  if (p <= 0 || p >= 1) return Infinity;
  if (p < 0.5) return -inverseCDF(1 - p);
  const t = Math.sqrt(-2 * Math.log(1 - p));
  const c0 = 2.515517, c1 = 0.802853, c2 = 0.010328;
  const d1 = 1.432788, d2 = 0.189269, d3 = 0.001308;
  return t - (c0 + c1 * t + c2 * t * t) / (1 + d1 * t + d2 * t * t + d3 * t * t * t);
}
Analyzing Results at Each Checkpoint
function analyzeAtCheckpoint(experiment, lookIndex, controlData, variantData) {
  const boundary = experiment.boundaries[lookIndex];
  const { sampleAtLook, zBoundary } = boundary;

  // Ensure we have enough data for this look
  if (controlData.count < sampleAtLook || variantData.count < sampleAtLook) {
    return { decision: 'wait', reason: 'Insufficient sample size for this checkpoint' };
  }

  // Two-proportion z-test
  const p1 = controlData.conversions / controlData.count;
  const p2 = variantData.conversions / variantData.count;
  const pPooled = (controlData.conversions + variantData.conversions)
    / (controlData.count + variantData.count);
  const se = Math.sqrt(pPooled * (1 - pPooled) * (1 / controlData.count + 1 / variantData.count));
  const zScore = (p2 - p1) / se;

  const isSignificant = Math.abs(zScore) > zBoundary;
  const isFinalLook = lookIndex === experiment.boundaries.length - 1;

  if (isSignificant) {
    return {
      decision: 'stop',
      winner: zScore > 0 ? 'variant' : 'control',
      zScore,
      zBoundary,
      controlRate: p1,
      variantRate: p2,
      relativeLift: ((p2 - p1) / p1 * 100).toFixed(1) + '%',
    };
  }

  if (isFinalLook) {
    return { decision: 'no-difference', zScore, zBoundary };
  }

  return { decision: 'continue', zScore, zBoundary, nextLookAt: experiment.boundaries[lookIndex + 1].sampleAtLook };
}
Putting It Together for a Deep Link Test
// A/B test: two landing page variants for a smart banner deep link
const experiment = createSequentialExperiment({
  maxSamplePerVariant: 15000,
  numLooks: 4,          // Analyze at 25%, 50%, 75%, 100%
  alphaTotal: 0.05,
  spendingFunction: 'obrien-fleming',
});

console.log('Boundaries:');
experiment.boundaries.forEach((b) => {
  console.log(
    `  Look at ${b.sampleAtLook} per variant: z > ${b.zBoundary.toFixed(3)} to reject`
  );
});

// At the second interim look (50% of data collected)
const result = analyzeAtCheckpoint(experiment, 1,
  { count: 7500, conversions: 525 },   // Control: 7.0% conversion
  { count: 7500, conversions: 637 },   // Variant: 8.5% conversion
);

console.log(result);
// { decision: 'stop', winner: 'variant', relativeLift: '21.4%', ... }
For more on the statistical foundations, see Statistical Significance for A/B Tests.
Always-Valid Inference: Continuous Monitoring
Group sequential designs require you to pre-specify the number of looks. Always-valid inference (also called "anytime-valid" testing) goes a step further: you can check results after every single observation without any alpha inflation.
The key idea is to use confidence sequences instead of confidence intervals. A confidence sequence is valid at all sample sizes simultaneously, not just at the final analysis.
/**
 * Mixture sequential probability ratio test (mSPRT).
 * Returns a "wealth" value; reject H0 when wealth > 1/alpha.
 */
function msprtStatistic(controlCount, controlConversions, variantCount, variantConversions, tau = 0.001) {
  const pC = controlConversions / controlCount;
  const pV = variantConversions / variantCount;
  const n = controlCount + variantCount;
  const pPool = (controlConversions + variantConversions) / n;

  const variance = pPool * (1 - pPool) * (1 / controlCount + 1 / variantCount);
  const delta = pV - pC;

  // Log-likelihood ratio with normal mixture
  const logLR = (delta * delta) / (2 * (variance + tau))
    - 0.5 * Math.log(1 + variance / tau);

  return Math.exp(logLR);
}

function checkAlwaysValid(controlData, variantData, alpha = 0.05) {
  const stat = msprtStatistic(
    controlData.count, controlData.conversions,
    variantData.count, variantData.conversions
  );

  return {
    statistic: stat,
    threshold: 1 / alpha,   // 20 for alpha = 0.05
    reject: stat > 1 / alpha,
  };
}
Always-valid methods are ideal for deep link experiments where traffic is unpredictable. You don't need to estimate a maximum sample size upfront. The tradeoff is slightly lower power compared to group sequential designs at any fixed sample size. In practice, you may need 10-30% more observations to reach the same conclusion.
When to Use Sequential vs. Fixed-Horizon
| Scenario | Recommended Approach |
|---|---|
| Predictable, high traffic (10K+ clicks/day) | Fixed-horizon (simplest, most powerful) |
| Moderate traffic, want early stopping for large effects | Group sequential (O'Brien-Fleming) |
| Low or unpredictable traffic, continuous monitoring needed | Always-valid inference |
| Testing during a time-limited campaign (product launch, holiday) | Group sequential (Pocock for easier early stopping) |
| Multiple concurrent tests across many deep link routes | Always-valid (no need to pre-plan sample sizes) |
For multivariate experiments with more than two variants, see Multivariate Testing for Deep Link Campaigns.
Practical Decision Rules
Sequential testing gives you statistical rigor. But real decisions require more than a p-value. Here are practical rules for deep link experiments:
1. Set a minimum effect size before starting. If a 2% lift in conversion isn't worth the engineering effort to ship variant B, don't run the test to detect 2% lifts. Set your minimum detectable effect at 10% or higher and size the experiment accordingly.
2. Define a maximum duration. Even with sequential testing, set a time limit. Deep link behavior changes with seasonality, app updates, and user composition. A test running for 6 months is measuring a moving target.
3. Use futility boundaries. In addition to checking whether the variant is significantly better, check whether it's "probably not better." If the z-score is close to zero at 50% of the planned sample size, consider stopping for futility and moving on to a different test.
function checkFutility(zScore, fractionComplete, futilityThreshold = 0.5) {
  // If the effect is small relative to what we'd need at this
  // fraction, continuing is unlikely to yield significance.
  const projectedFinalZ = zScore / Math.sqrt(fractionComplete);
  return projectedFinalZ < futilityThreshold;
}
4. Account for novelty effects. New deep link experiences often show inflated engagement in the first 48 hours. Exclude the first day or two from your sequential analysis, or set the first checkpoint at no less than 25% of the planned sample.
5. Log every decision. Record the checkpoint, z-score, boundary, and outcome. When you review experiments quarterly, you want a clear audit trail showing that each decision was statistically grounded, not just a gut call.
Applying This in Tolinku
Tolinku's A/B testing feature lets you split traffic across deep link variants and track conversion metrics per variant. When setting up an experiment, you can configure sequential testing parameters in your Appspace:
- Choose your alpha spending function (O'Brien-Fleming or Pocock)
- Set the number of interim analyses (3-5 looks is typical)
- Define your maximum sample size per variant
- Set futility boundaries to stop underperforming tests early
The analytics dashboard shows your current z-score relative to the sequential boundary at each checkpoint, making it clear whether you've crossed the threshold for a valid decision.
Key Takeaways
Sequential testing is not about cutting corners. It's about using your statistical budget more efficiently. Fixed-horizon tests waste time when the answer is obvious early, and they tempt teams into peeking (which invalidates the results). Sequential testing formalizes early stopping so you can act on strong evidence without compromising validity.
For deep link experiments specifically, the combination of variable traffic, time-sensitive campaigns, and multiple concurrent tests makes sequential testing the more practical choice. Start with a group sequential design using O'Brien-Fleming spending. If you find that traffic is too unpredictable to pre-plan sample sizes, move to always-valid inference.
The goal is the same as any testing framework: make better decisions, faster, with fewer false starts.
Get deep linking tips in your inbox
One email per week. No spam.