A campaign performance report should answer one question for each stakeholder: "What should we do differently?" Executives want ROI. Marketing managers want channel effectiveness. Product teams want user quality. If your report dumps raw data without interpretation, nobody reads it.
This guide covers how to structure campaign performance reports for deep link campaigns. For deep link analytics, see deep link analytics: measuring what matters. For UTM parameter strategy, see UTM parameter strategy for mobile deep links.
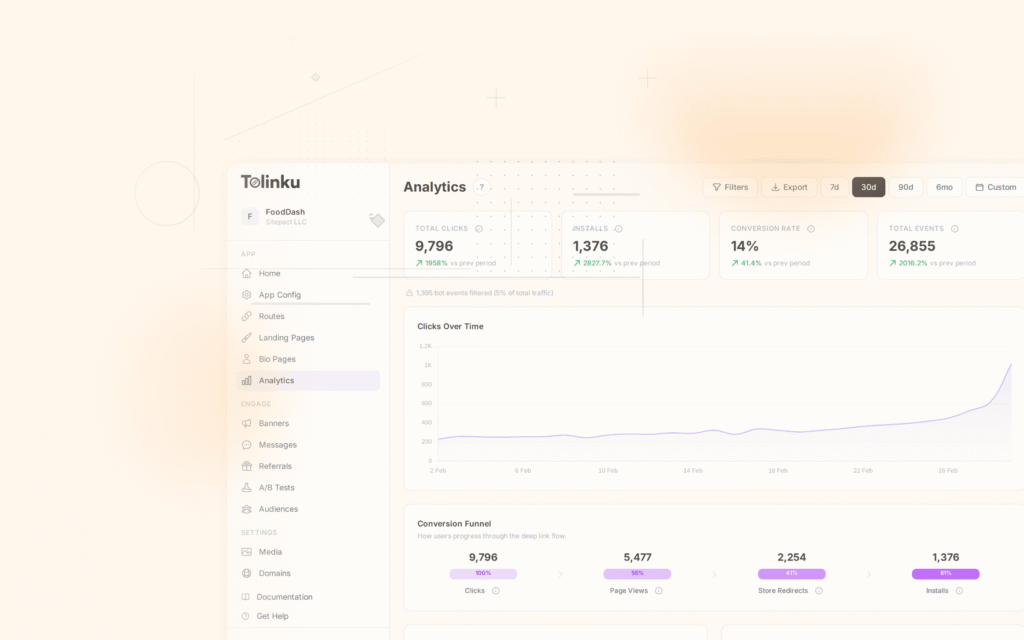
 The collapsible analytics filter panel with 10 dropdown filters for slicing data.
Report Structure
Executive Summary (1 page)
Lead with the headline: "Campaign X drove Y conversions at $Z CPA, exceeding/missing target by N%."
CAMPAIGN SUMMARY: July 2026
─────────────────────────────────────
Total deep link clicks:    45,200 (+12% MoM)
App opens from links:      32,500 (72% open rate)
Conversions:               4,100 (12.6% conversion rate)
Revenue attributed:        $82,000
Total campaign spend:      $35,000
ROAS:                      234%
Target ROAS:               200%
Status:                    EXCEEDING TARGET
─────────────────────────────────────
Channel Breakdown (1-2 pages)
| Channel | Clicks | App Opens | Conversions | CPA | ROAS |
|---|---|---|---|---|---|
| 18,000 | 14,400 | 2,050 | $4.88 | 310% | |
| Push notifications | 15,200 | 12,160 | 1,200 | $5.83 | 220% |
| Social (organic) | 5,000 | 3,000 | 450 | $0 | N/A |
| Paid social | 4,500 | 2,250 | 280 | $35.71 | 145% |
| QR codes | 2,500 | 625 | 120 | $8.33 | 180% |
Insight: Email has the highest ROAS and lowest CPA. Paid social is the weakest performer. Consider shifting budget from paid social to email and QR code campaigns.
Funnel Analysis (1 page)
Deep Link Funnel: Email Campaign "summer-savings"

Click          → App Open       → Target Screen  → CTA Tap       → Conversion
18,000         → 14,400 (80%)   → 13,200 (92%)   → 6,600 (50%)  → 2,050 (31%)
               ↓                 ↓                 ↓               ↓
               3,600 fallback    1,200 bounced     6,600 abandoned 4,550 not completed
The biggest drop-off is at "CTA Tap" (50% of users who see the target screen do not tap the CTA). This suggests the landing screen needs optimization, not the deep link itself.
Deep Link Performance (1 page)
| Route | Clicks | Open Rate | Conversion | Top Source |
|---|---|---|---|---|
/offers/summer-sale |
12,000 | 78% | 15.2% | |
/products/savings |
8,500 | 70% | 10.5% | Push |
/referral |
5,200 | 82% | 18.0% | Social share |
/dashboard |
4,500 | 68% | 3.2% | Push |
/settings/notifications |
2,000 | 65% | N/A | Push |
The referral route has the highest conversion rate (18%), confirming that referred users convert at higher rates. The dashboard route has low conversion because there is no specific conversion action associated with it.
Report Templates
Weekly Report
Frequency: Every Monday morning.
Contents:
- Week-over-week metrics (clicks, opens, conversions, revenue).
- Top 5 performing deep links (by conversion rate).
- Bottom 5 performing deep links (by open rate, investigating issues).
- Campaign-specific highlights (any campaigns launched or ending this week).
- Anomalies (unusual patterns, errors, unexpected spikes/drops).
- Action items (2-3 specific recommendations for the coming week).
Monthly Report
Frequency: First week of each month.
Contents:
- Executive summary with month-over-month trends.
- Channel breakdown with ROAS and CPA by channel.
- Cohort analysis (how this month's users compare to previous months).
- Deep link performance by route, campaign, and source.
- Funnel analysis for the top 3 campaigns.
- A/B test results (if any tests were run).
- Platform breakdown (iOS vs Android vs web fallback).
- Geographic performance (clicks and conversions by region).
- Recommendations for next month.
Quarterly Report
Frequency: End of each quarter.
Contents:
- Quarter summary with quarter-over-quarter trends.
- Budget allocation analysis (did we spend on the right channels?).
- LTV by acquisition source (which deep link sources produce the most valuable users?).
- Retention cohorts (are users from deep links retaining better over time?).
- Strategic recommendations for next quarter.
Metrics by Audience
For Executives
Focus on business impact:
- Revenue attributed to deep link campaigns. Total revenue driven by deep links.
- ROAS by channel. Where each dollar is most effective.
- Customer acquisition cost. How much it costs to acquire a converting user via deep links.
- Quarter-over-quarter growth. Trend line of deep link-driven revenue.
For Marketing Managers
Focus on campaign optimization:
- Click-through rates by campaign. Which campaigns get the most engagement.
- Conversion rates by source. Which channels produce the best converters.
- A/B test results. What creative/copy/timing variations performed best.
- Funnel drop-off points. Where users abandon after clicking a deep link.
For Product Teams
Focus on user quality:
- Retention by deep link source. Do deep-linked users retain better than organic?
- Feature adoption by entry point. Which routes lead to the most feature discovery?
- Error rates by route. Which routes have technical issues?
- Fallback rate by platform. How well are Universal Links / App Links working?
Automation
Scheduled Report Generation
interface ReportConfig {
  name: string;
  frequency: 'daily' | 'weekly' | 'monthly';
  recipients: string[];
  sections: ReportSection[];
  format: 'pdf' | 'html' | 'csv';
}

async function generateReport(config: ReportConfig): Promise<Report> {
  const dateRange = getDateRange(config.frequency);
  const data: Record<string, any> = {};

  for (const section of config.sections) {
    switch (section.type) {
      case 'summary':
        data.summary = await getSummaryMetrics(dateRange);
        break;
      case 'channels':
        data.channels = await getChannelBreakdown(dateRange);
        break;
      case 'funnel':
        data.funnel = await getFunnelData(dateRange, section.campaigns);
        break;
      case 'routes':
        data.routes = await getRoutePerformance(dateRange);
        break;
      case 'cohorts':
        data.cohorts = await getCohortData(dateRange);
        break;
    }
  }

  return renderReport(config, data);
}
Data Export
Export raw data for custom analysis:
async function exportCampaignData(
  campaign: string,
  dateRange: DateRange,
  format: 'csv' | 'json'
): Promise<string> {
  const clicks = await analyticsDB.query(`
    SELECT
      click_id, timestamp, route, source, medium, campaign,
      platform, country, city, outcome, latency_ms
    FROM deep_link_clicks
    WHERE campaign = ? AND timestamp BETWEEN ? AND ?
    ORDER BY timestamp
  `, [campaign, dateRange.start, dateRange.end]);

  return format === 'csv' ? toCSV(clicks) : JSON.stringify(clicks);
}
Common Report Mistakes
- Data without insight. "Clicks went up 15%" is data. "Clicks went up 15% because of the email campaign, which we should scale next month" is insight.
- Too many metrics. If the report has 50 metrics, nobody reads it. Focus on 5-7 key metrics per audience.
- No comparison. Always compare to a baseline: last period, target, or benchmark.
- Ignoring negative results. Report what did not work and why. This is more actionable than reporting successes.
- No action items. Every report should end with 2-3 specific, actionable recommendations.
Tolinku for Campaign Reporting
Tolinku's analytics provide campaign-level reporting with click, conversion, and attribution data. Export data from the Tolinku dashboard for custom reports, or use the built-in charts and funnels for standard reporting.
For deep link analytics, see deep link analytics: measuring what matters. For UTM parameters, see UTM parameter strategy for mobile deep links.
Get deep linking tips in your inbox
One email per week. No spam.