Clicks and installs are interesting. Revenue is what matters. Revenue attribution connects the money your users spend back to the specific deep links, campaigns, and channels that brought them in.
Without revenue attribution, you can't answer the most important question in marketing: "Where should I spend my next dollar?"
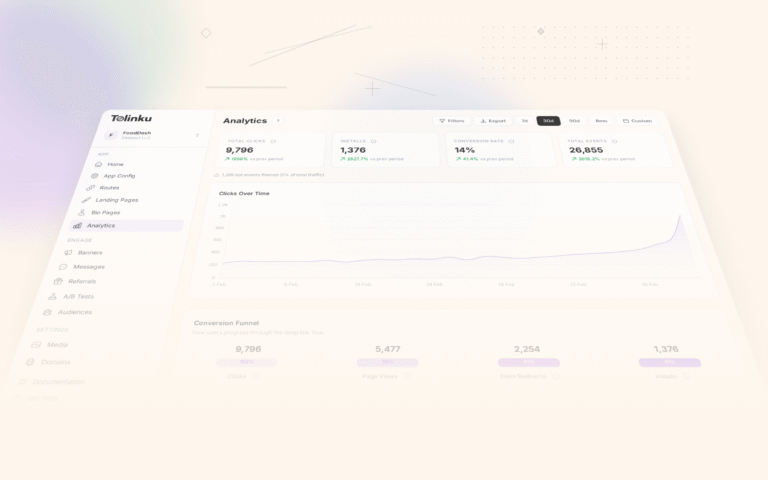
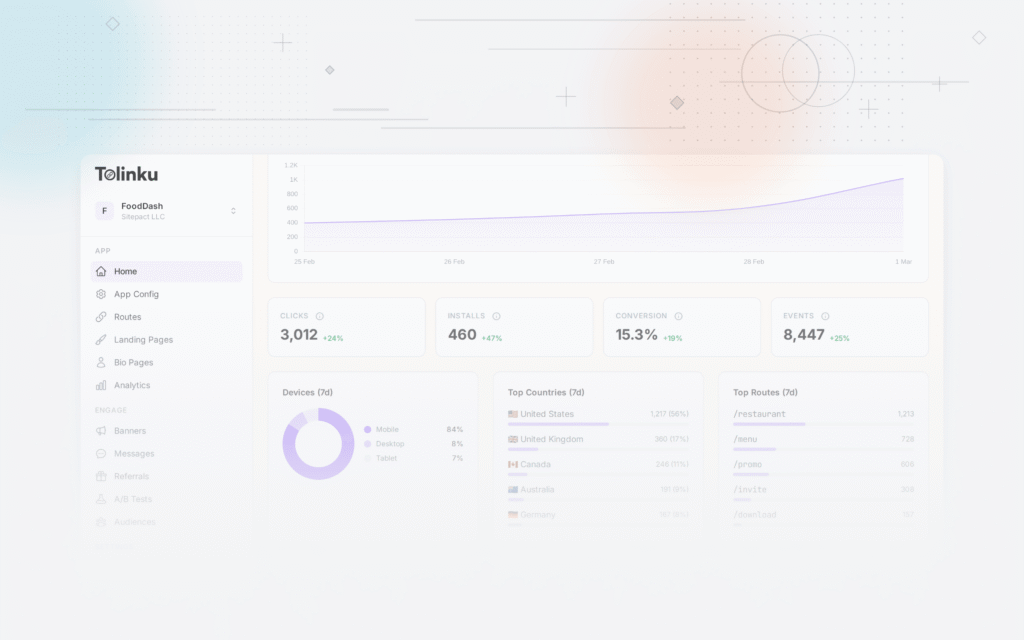
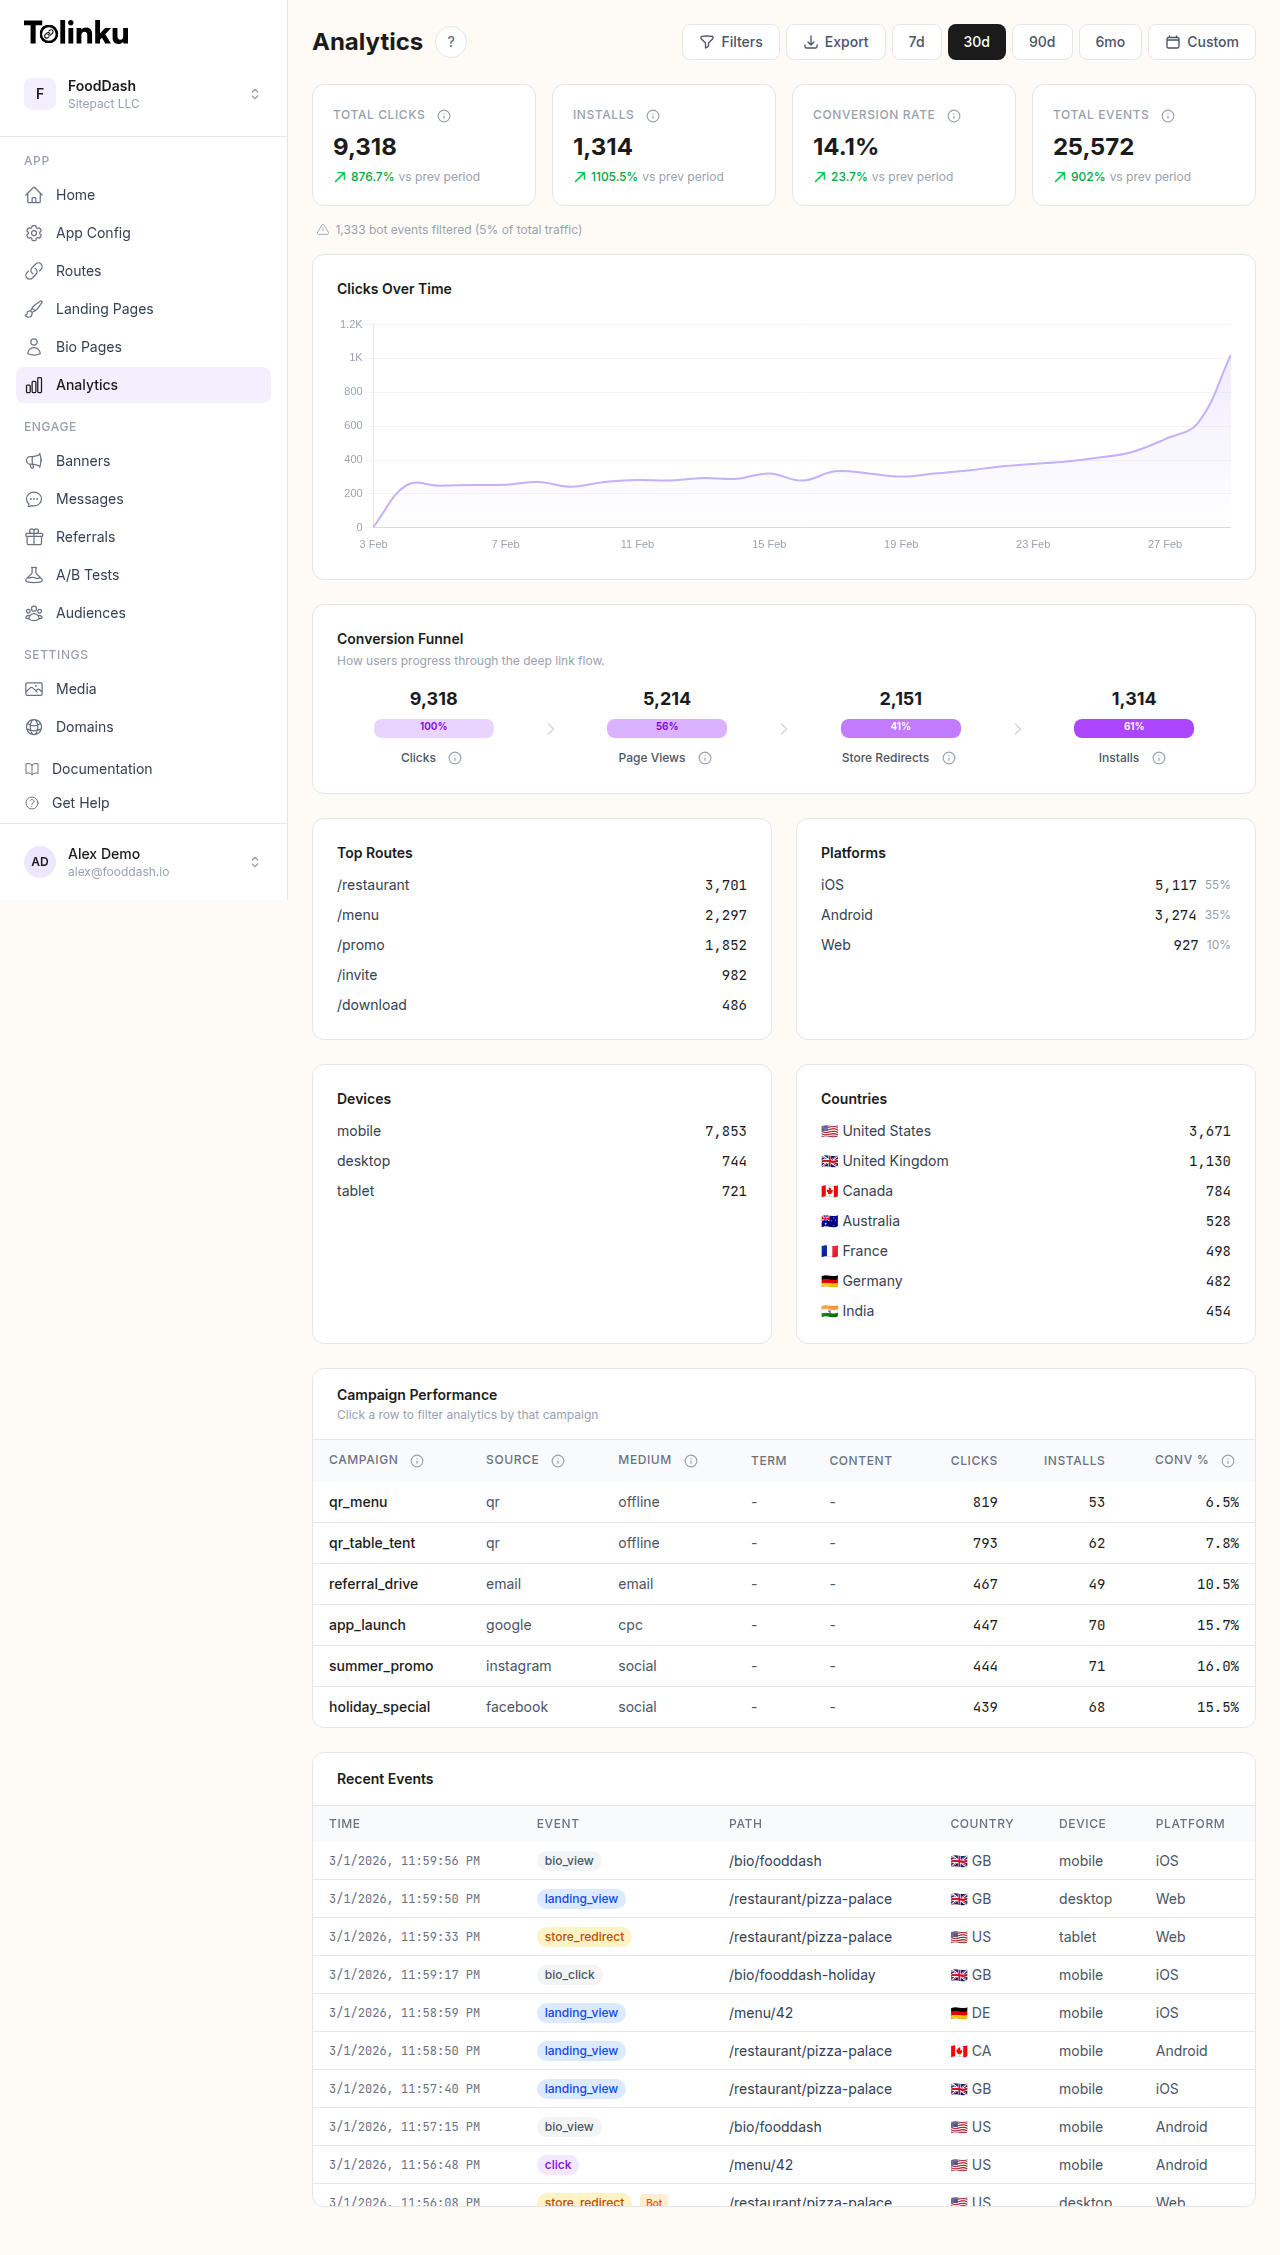 The analytics dashboard with date range selector, filters, charts, and breakdowns.
Why Revenue Attribution Is Different
Standard attribution tells you which link drove the install. Revenue attribution goes further: it tells you which link drove revenue, how much revenue, and over what time period.
This distinction matters because the channels that drive the most installs aren't always the channels that drive the most revenue. A social media campaign might drive 10,000 installs with $2,000 in revenue. An email campaign might drive 1,000 installs with $5,000 in revenue. Without revenue attribution, you'd double down on social media. With it, you'd invest more in email.
The Revenue Attribution Chain
To attribute revenue to a deep link, you need an unbroken chain from click to purchase:
1. Click: User clicks a deep link (with campaign/channel identifiers) 2. Install/Open: User installs or opens the app (link context preserved) 3. Session: User is identified and the source link is recorded in their profile 4. Purchase: User makes a purchase (the purchase event includes the attribution source) 5. Attribution: Revenue is credited to the original link/campaign/channel
The chain breaks if any step loses the link context. Common break points:
- Deferred deep linking fails (new user context lost through install)
- Attribution window expires (user purchased 45 days after click, but window was 30 days)
- User switches devices (clicked on desktop, purchased on mobile)
- Server-side events don't include attribution data
Setting Up Revenue Attribution
Define Your Revenue Events
Map all the ways your app generates revenue:
| Revenue Type | Event Name | Key Properties |
|---|---|---|
| One-time purchase | purchase |
value, currency, product_id |
| Subscription start | subscription_started |
plan, value, billing_period |
| Subscription renewal | subscription_renewed |
plan, value, period_number |
| In-app purchase | iap_completed |
item_id, value, currency |
| Ad revenue | ad_impression |
ad_unit, estimated_revenue |
Attach Attribution Context
Every revenue event must carry the attribution context: which link, campaign, and channel originally brought the user in.
Client-side approach: When the app handles a deep link, store the attribution data (link ID, UTM parameters, campaign name) in the user session. Attach it to all subsequent events.
Server-side approach: Store attribution data in the user's profile on your backend. When processing purchases, look up the user's attribution source and include it in the revenue event.
The server-side approach is more reliable because it doesn't depend on the app being open or the SDK being initialized.
Handle Attribution Windows
Users don't always purchase immediately. Define how long after a click you'll attribute revenue:
- Session window: Only revenue within the same app session as the click
- 7-day window: Revenue within 7 days of the click
- 30-day window: Revenue within 30 days (most common for e-commerce)
- Lifetime: All revenue ever generated by the user, attributed to the link that acquired them
For subscription apps, lifetime attribution is often most appropriate because the initial acquisition drives ongoing revenue for months or years. For e-commerce, a 30-day window captures the typical purchase cycle without over-attributing.
Multi-Purchase Attribution
When a user makes multiple purchases, should all revenue be attributed to the original acquisition link?
First-touch lifetime: All revenue attributed to the link that first brought the user in. Simple, useful for evaluating acquisition channels.
Re-engagement attribution: If a user makes a purchase after clicking a re-engagement deep link (email, push notification), attribute that specific purchase to the re-engagement campaign, not the original acquisition.
Practical approach: Use first-touch for evaluating acquisition channel LTV. Use last-touch for evaluating specific campaign ROI. Both views are useful for different decisions.
Revenue Metrics by Channel
Key Revenue Attribution Reports
Revenue per click: Total attributed revenue / total clicks for a link or campaign.
This is the clearest efficiency metric. A link with $0.50 revenue per click is more valuable than one with $0.10 revenue per click, regardless of total click volume.
Revenue per install: Total attributed revenue / total installs from a campaign.
Useful for comparing paid acquisition channels where you pay per install. If Facebook delivers $8 revenue per install and TikTok delivers $3, Facebook users are more valuable (assuming similar CPIs).
ROAS (Return on Ad Spend): Attributed revenue / campaign spend.
The bottom line for paid campaigns. ROAS of 2.0 means you earned $2 for every $1 spent.
LTV by channel: Projected lifetime value of users attributed to each channel.
The most strategic metric. It tells you not just what users spent in the attribution window, but what they're projected to spend over their lifetime. Use this for long-term budget allocation.
Example Channel Comparison
| Channel | Spend | Installs | CPI | 30d Revenue | 30d ROAS | Projected LTV | LTV:CPI |
|---|---|---|---|---|---|---|---|
| $500 | 2,400 | $0.21 | $10,080 | 20.2x | $8.50 | 40.5x | |
| Facebook Ads | $11,250 | 3,750 | $3.00 | $7,875 | 0.7x | $5.20 | 1.7x |
| Google Ads | $8,000 | 2,000 | $4.00 | $6,000 | 0.75x | $6.80 | 1.7x |
| Referral | $1,800 | 1,800 | $1.00 | $12,240 | 6.8x | $11.20 | 11.2x |
| Organic Search | $0 | 5,000 | $0 | $15,000 | infinity | $4.50 | infinity |
This table immediately shows that referral and email are the highest-value channels, while paid ads are barely breaking even at 30 days (though projected LTV suggests they'll become profitable).
Subscription Revenue Attribution
Subscription apps have unique attribution challenges:
Initial vs Recurring Revenue
When a user subscribes at $9.99/month, the first month's revenue is clearly attributable to the acquisition link. But what about month 6? Month 12?
Common approaches:
- Full attribution: All subscription revenue for the user's lifetime is attributed to the acquisition source
- Cohort-based: Track total revenue per acquisition cohort over time (the "LTV curve")
- Discounted attribution: Future revenue is discounted by a factor that decreases over time (recognizing that the link's influence weakens)
For most apps, full attribution of subscription revenue to the acquisition source is the simplest and most useful model.
Trial-to-Paid Conversion
For freemium or trial-based apps, attribution should track not just the install but the conversion to paid:
- Which channels have the highest trial-to-paid conversion rate?
- What's the average time from install to conversion by channel?
- Which channels drive users who choose annual vs monthly plans?
A channel with fewer installs but higher trial-to-paid conversion may generate more total revenue.
Churn and Revenue Recovery
When a subscriber churns and later resubscribes (often through a re-engagement deep link), attribute the resubscription revenue to the re-engagement campaign, not the original acquisition.
This lets you evaluate the effectiveness of win-back campaigns separately from acquisition campaigns.
In-App Purchase Attribution
For apps with in-app purchases (gaming, content, utilities):
First Purchase vs Repeat Purchases
Track both:
- First purchase attribution: Which link/campaign drove the user's first purchase? (Evaluates acquisition quality)
- Total revenue attribution: What's the total revenue generated by users from each source? (Evaluates LTV)
Purchase Value Distribution
Not all users spend equally. Analyze the revenue distribution by channel:
- What percentage of users from each channel make any purchase?
- What's the median purchase value by channel?
- Are there "whale" concentrations (heavy spenders) from specific channels?
A channel that attracts a few heavy spenders may have a high average revenue per install but high variance. A channel with many moderate spenders may be more predictable.
Using Revenue Attribution for Decisions
Budget Reallocation
The primary use of revenue attribution: shift marketing budget toward channels with the best revenue efficiency.
Review monthly:
- Rank channels by LTV:CPI ratio
- Increase budget for channels above your target ratio
- Decrease budget for channels below your target ratio
- Test new channels with a small exploration budget
Creative Optimization
Within a channel, revenue attribution tells you which creatives attract the most valuable users:
- Creative A drives 500 installs with $3,000 in 30-day revenue ($6/install)
- Creative B drives 300 installs with $4,500 in 30-day revenue ($15/install)
Creative B attracts fewer but more valuable users. Scale it.
Product Investment
Revenue attribution can inform product decisions:
- If referral users have 3x higher LTV, invest more in the referral experience
- If users who enter through a specific deep link convert at higher rates, improve that entry point
- If a specific onboarding path produces higher-value users, make it the default
Use your analytics to connect deep link sources to downstream revenue and make these decisions with data.
For the technical foundation of attribution, see Mobile Attribution: A Developer's Guide. For a broader view of analytics for deep links, see Deep Link Analytics: Measuring What Matters.
Get deep linking tips in your inbox
One email per week. No spam.