
Statistical significance tells you whether the difference between your A/B test variants is real or just random noise. Without understanding it, you'll either call winners too early (wasting effort on changes that don't actually work) or run tests too long (missing opportunities). This guide explains what statistical significance means in practical terms, how to calculate it, and how to use it correctly for deep link experiments.
For sample size planning, see A/B Testing Sample Size Calculator for Deep Links. For reading test results, see Measuring A/B Test Results for Deep Link Campaigns.
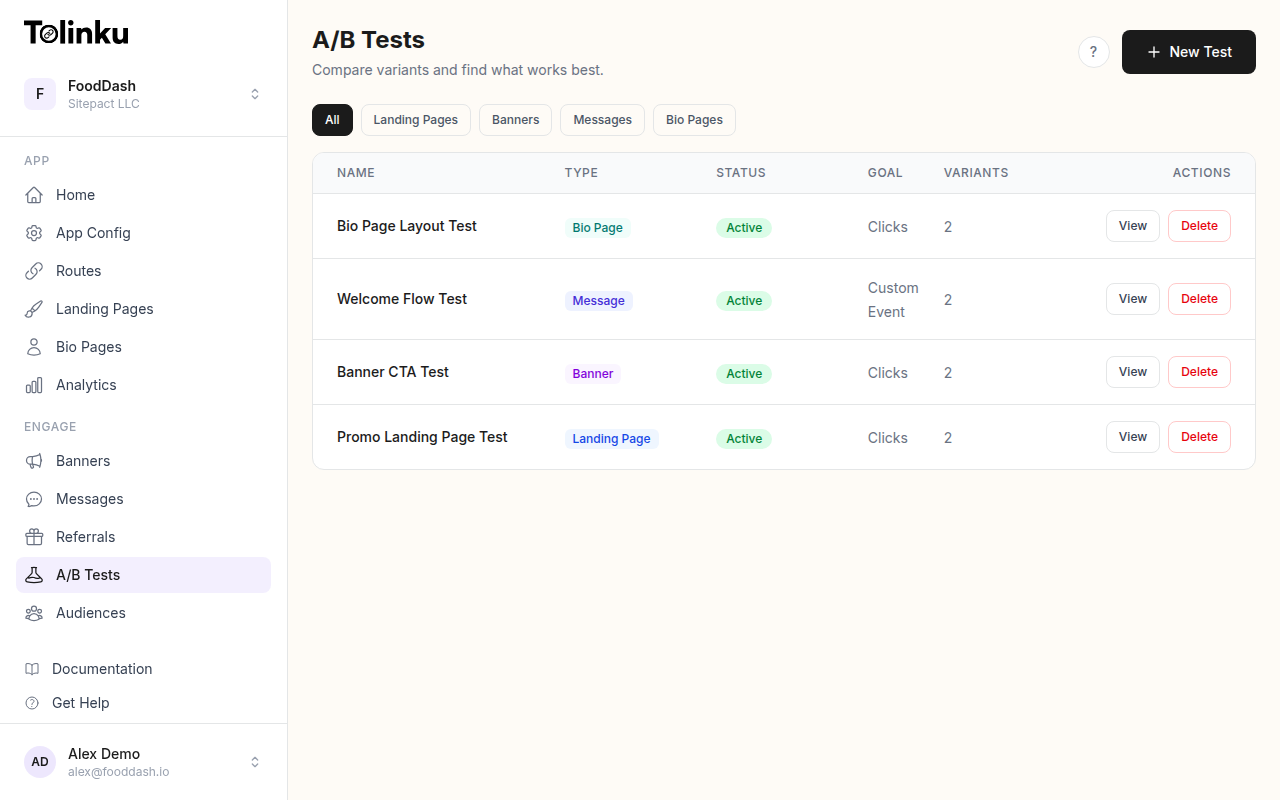 The A/B tests list page showing test names, status, types, and variant counts.
What Statistical Significance Actually Means
The Core Question
When you run an A/B test and Variant B converts at 5.2% vs. Variant A's 4.8%, is that 8.3% lift real? Or could it be random chance?
Statistical significance answers this: if there were truly no difference between the variants, how likely would you be to see a result this extreme (or more extreme) by chance?
If that probability is very low (typically below 5%), we call the result "statistically significant."
P-Value Explained
The p-value is this probability. A p-value of 0.03 means: "If both variants were identical, there's a 3% chance you'd see a difference this large just from random variation."
function interpretPValue(pValue) {
  if (pValue < 0.01) return 'Highly significant (99%+ confidence)';
  if (pValue < 0.05) return 'Significant (95%+ confidence)';
  if (pValue < 0.10) return 'Marginally significant (90%+ confidence)';
  return 'Not significant';
}
Common misconceptions:
- p = 0.05 does not mean "95% chance B is better." It means "5% chance of seeing this result if they were equal."
- A "not significant" result does not mean the variants are equal. It means you don't have enough evidence to conclude they're different.
- A significant result does not mean the effect is large. Small, meaningless differences can be significant with enough data.
Confidence Level vs. Confidence Interval
| Concept | What It Is | Example |
|---|---|---|
| Confidence level | The threshold for declaring significance | 95% (alpha = 0.05) |
| Confidence interval | The range of plausible values for the true effect | 3.2% to 13.4% lift |
| P-value | The probability of the observed result under no real difference | 0.03 |
Confidence intervals are more useful than p-values because they tell you the magnitude of the effect, not just whether it exists:
function confidenceInterval(conversionsA, totalA, conversionsB, totalB, confidenceLevel = 0.95) {
  const pA = conversionsA / totalA;
  const pB = conversionsB / totalB;
  const diff = pB - pA;

  const se = Math.sqrt(pA * (1 - pA) / totalA + pB * (1 - pB) / totalB);

  const zScore = confidenceLevel === 0.95 ? 1.96 : confidenceLevel === 0.99 ? 2.576 : 1.645;

  return {
    pointEstimate: diff,
    lower: diff - zScore * se,
    upper: diff + zScore * se,
    relativeLift: (diff / pA * 100).toFixed(1) + '%',
  };
}

// Example: Banner A = 300/10000, Banner B = 350/10000
const ci = confidenceInterval(300, 10000, 350, 10000);
// { pointEstimate: 0.005, lower: -0.002, upper: 0.012, relativeLift: '16.7%' }
// The confidence interval includes 0, so this is NOT significant
Calculating Statistical Significance
Two-Proportion Z-Test
The standard test for comparing conversion rates:
function zTest(conversionsA, totalA, conversionsB, totalB) {
  const pA = conversionsA / totalA;
  const pB = conversionsB / totalB;

  // Pooled proportion
  const pPooled = (conversionsA + conversionsB) / (totalA + totalB);

  // Standard error
  const se = Math.sqrt(pPooled * (1 - pPooled) * (1 / totalA + 1 / totalB));

  // Z-score
  const z = (pB - pA) / se;

  // Two-tailed p-value (approximation)
  const pValue = 2 * (1 - normalCDF(Math.abs(z)));

  return {
    rateA: (pA * 100).toFixed(2) + '%',
    rateB: (pB * 100).toFixed(2) + '%',
    zScore: z.toFixed(3),
    pValue: pValue.toFixed(4),
    significant: pValue < 0.05,
    lift: ((pB - pA) / pA * 100).toFixed(1) + '%',
  };
}

function normalCDF(x) {
  // Approximation of the cumulative normal distribution
  const t = 1 / (1 + 0.2316419 * Math.abs(x));
  const d = 0.3989422804014327;
  const p = d * Math.exp(-x * x / 2) * t *
    (0.3193815 + t * (-0.3565638 + t * (1.781478 + t * (-1.821256 + t * 1.330274))));
  return x > 0 ? 1 - p : p;
}
Example Calculations
// Scenario 1: Clear winner
const test1 = zTest(150, 5000, 210, 5000);
// Rate A: 3.00%, Rate B: 4.20%
// z = 3.12, p = 0.0018 -> Significant (40% lift)

// Scenario 2: Not enough data
const test2 = zTest(15, 500, 21, 500);
// Rate A: 3.00%, Rate B: 4.20%
// z = 0.99, p = 0.32 -> Not significant (same rates, less data)

// Scenario 3: Large sample, small difference
const test3 = zTest(500, 10000, 520, 10000);
// Rate A: 5.00%, Rate B: 5.20%
// z = 0.65, p = 0.52 -> Not significant (4% lift too small to detect)
When to Check Results
The Peeking Problem
Checking results repeatedly inflates your false positive rate:
| Check Frequency | Actual False Positive Rate (vs. intended 5%) |
|---|---|
| Once (at planned end) | 5% |
| Daily for 7 days | ~15% |
| Daily for 14 days | ~20% |
| Daily for 30 days | ~25-30% |
Every time you check, you give randomness another chance to fool you.
Solutions to the Peeking Problem
Option 1: Fixed-horizon testing. Set a sample size. Don't look until you reach it.
function shouldCheck(experiment) {
  const currentSample = experiment.totalImpressions;
  const requiredSample = experiment.requiredSampleSize;

  // Only check at predetermined points
  const checkpoints = [
    requiredSample * 0.5,
    requiredSample * 0.75,
    requiredSample,
  ];

  return checkpoints.some(cp =>
    currentSample >= cp && currentSample < cp + experiment.dailyTraffic
  );
}
Option 2: Sequential testing. Use a stricter threshold that adjusts for multiple looks:
function sequentialSignificance(pValue, numLooks) {
  // O'Brien-Fleming spending function (alpha spending)
  // Gets stricter early, more lenient later
  const spendingFunction = (fraction) => {
    return 2 * (1 - normalCDF(1.96 / Math.sqrt(fraction)));
  };

  const fraction = numLooks / totalPlannedLooks;
  const adjustedAlpha = spendingFunction(fraction);

  return pValue < adjustedAlpha;
}
Option 3: Always Valid Inference. Use confidence sequences that remain valid at any stopping point:
function alwaysValidConfidence(conversionsA, totalA, conversionsB, totalB) {
  const pA = conversionsA / totalA;
  const pB = conversionsB / totalB;
  const diff = pB - pA;

  // Wider interval that accounts for continuous monitoring
  const se = Math.sqrt(pA * (1 - pA) / totalA + pB * (1 - pB) / totalB);
  const mixingRate = 1 / Math.sqrt(totalA + totalB);
  const adjustedWidth = 1.96 * se * Math.sqrt(1 + mixingRate * Math.log(1 + (totalA + totalB)));

  return {
    lower: diff - adjustedWidth,
    upper: diff + adjustedWidth,
    significant: diff - adjustedWidth > 0 || diff + adjustedWidth < 0,
  };
}
Common Scenarios
Scenario 1: Significant but Small Effect
Variant A: 4.00% conversion (2000 / 50000)
Variant B: 4.15% conversion (2075 / 50000)
p-value: 0.03 (significant)
Lift: 3.75%
The result is statistically significant, but a 3.75% relative lift might not be worth the engineering effort to implement permanently. Use practical significance alongside statistical significance.
Scenario 2: Large Effect but Not Significant
Variant A: 3.00% conversion (30 / 1000)
Variant B: 4.50% conversion (45 / 1000)
p-value: 0.07 (not significant)
Lift: 50%
A 50% lift is huge, but with only 1000 samples per variant, you can't be sure it's real. Options:
- Continue running the test to collect more data
- Lower your confidence threshold to 90% (marginally significant at p = 0.07)
- Use it as evidence to run a larger, properly powered test
Scenario 3: One Variant Wins on Clicks, Other on Conversions
CTA clicks: A = 5.0%, B = 4.2% (A wins, p = 0.01)
Installs:   A = 1.8%, B = 2.3% (B wins, p = 0.04)
Both results are significant but point in different directions. This means Variant A generates more clicks but lower-quality traffic. Decide based on which metric matters more to your business (usually the downstream metric, installs in this case).
Choosing Your Confidence Level
95% Confidence (Standard)
Use for decisions that are hard to reverse:
- Changing the default deep link destination for all traffic
- Redesigning the smart banner permanently
- Modifying the onboarding flow for all new users
90% Confidence (Exploratory)
Use for low-risk, reversible decisions:
- Testing CTA text that can be changed back instantly
- Initial screening of many variants (to narrow to 2-3 for a 95% test)
- Seasonal campaigns with limited time windows
99% Confidence (High Stakes)
Use when the cost of being wrong is very high:
- Changes to payment flows
- Pricing experiments
- Changes that affect regulatory compliance
Practical Decision Framework
function makeDecision(testResults) {
  const { pValue, lift, confidenceInterval, sampleSize, requiredSample } = testResults;

  // Check if test is complete
  if (sampleSize < requiredSample) {
    return { decision: 'WAIT', reason: `Need ${requiredSample - sampleSize} more samples` };
  }

  // Check statistical significance
  if (pValue >= 0.05) {
    if (pValue < 0.10 && Math.abs(lift) > 10) {
      return { decision: 'EXTEND', reason: 'Marginally significant with large effect. Run longer.' };
    }
    return { decision: 'NO_WINNER', reason: 'No significant difference detected.' };
  }

  // Check practical significance
  if (Math.abs(lift) < 3) {
    return { decision: 'NO_WINNER', reason: 'Statistically significant but too small to matter.' };
  }

  // Check confidence interval width
  const ciWidth = confidenceInterval.upper - confidenceInterval.lower;
  if (ciWidth > 0.1) {
    return { decision: 'EXTEND', reason: 'Significant but confidence interval too wide.' };
  }

  // Winner
  return {
    decision: 'WINNER',
    winner: lift > 0 ? 'B' : 'A',
    lift: lift,
    confidence: pValue < 0.01 ? '99%' : '95%',
  };
}
Best Practices
- Set your significance threshold before the test starts: Don't move the goalposts after seeing results.
- Report confidence intervals, not just p-values: The range of plausible effects is more useful than a binary yes/no.
- Use one-tailed tests only when justified: If you truly don't care whether B is worse than A, a one-tailed test gives more power. But be honest about your intention.
- Account for multiple comparisons: Testing 4 variants means 6 pairwise comparisons. Use Bonferroni correction or control the false discovery rate.
- Distinguish statistical from practical significance: A 0.5% lift that's statistically significant probably isn't worth implementing.
- Don't stop tests on weekends: Traffic patterns differ by day. Always complete full weeks.
- Document your analysis plan: Before starting, write down what you'll measure, what threshold you'll use, and when you'll check.
For A/B testing features, see Tolinku A/B testing. For interpreting results, see the A/B testing results docs.
Get deep linking tips in your inbox
One email per week. No spam.