Referral programs are not set-and-forget. The difference between a program that generates 5% of new users and one that generates 30% often comes down to optimization. A/B testing is how you find that gap.
The challenge with referral A/B testing is that the funnel is long and multi-party. The referrer shares a link, the friend clicks it, installs the app, signs up, and completes a qualifying action. You're testing across two different users (referrer and friend), multiple platforms, and a conversion flow that can take days. This makes test design more nuanced than standard landing page or email A/B tests.
This guide covers what to test, how to structure tests, and how to measure results. For the general referral program framework, see building referral programs that actually work. For A/B testing deep links and landing pages specifically, see the A/B testing deep links guide.
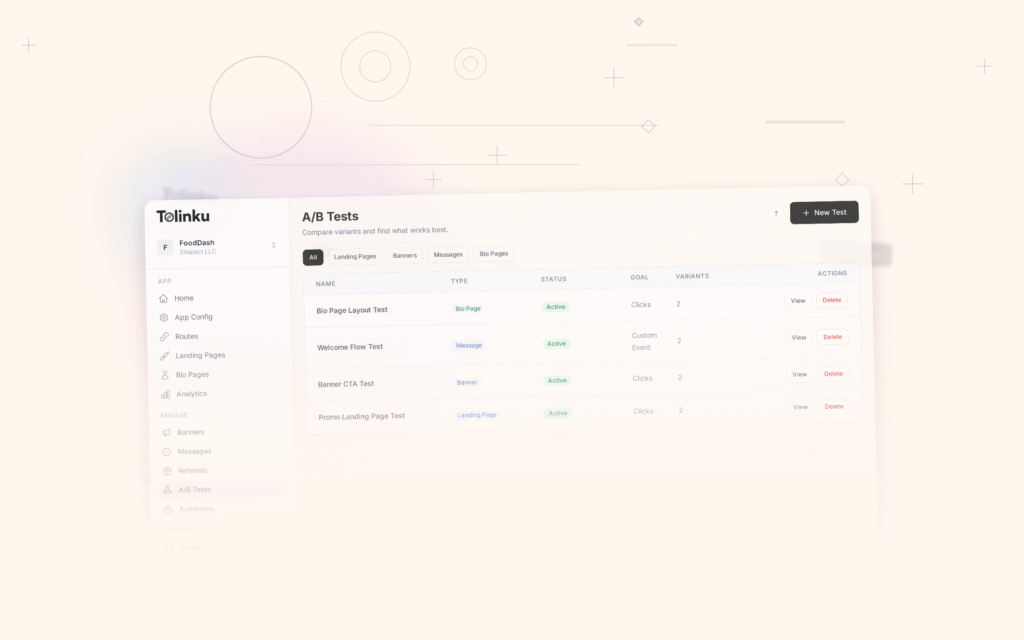
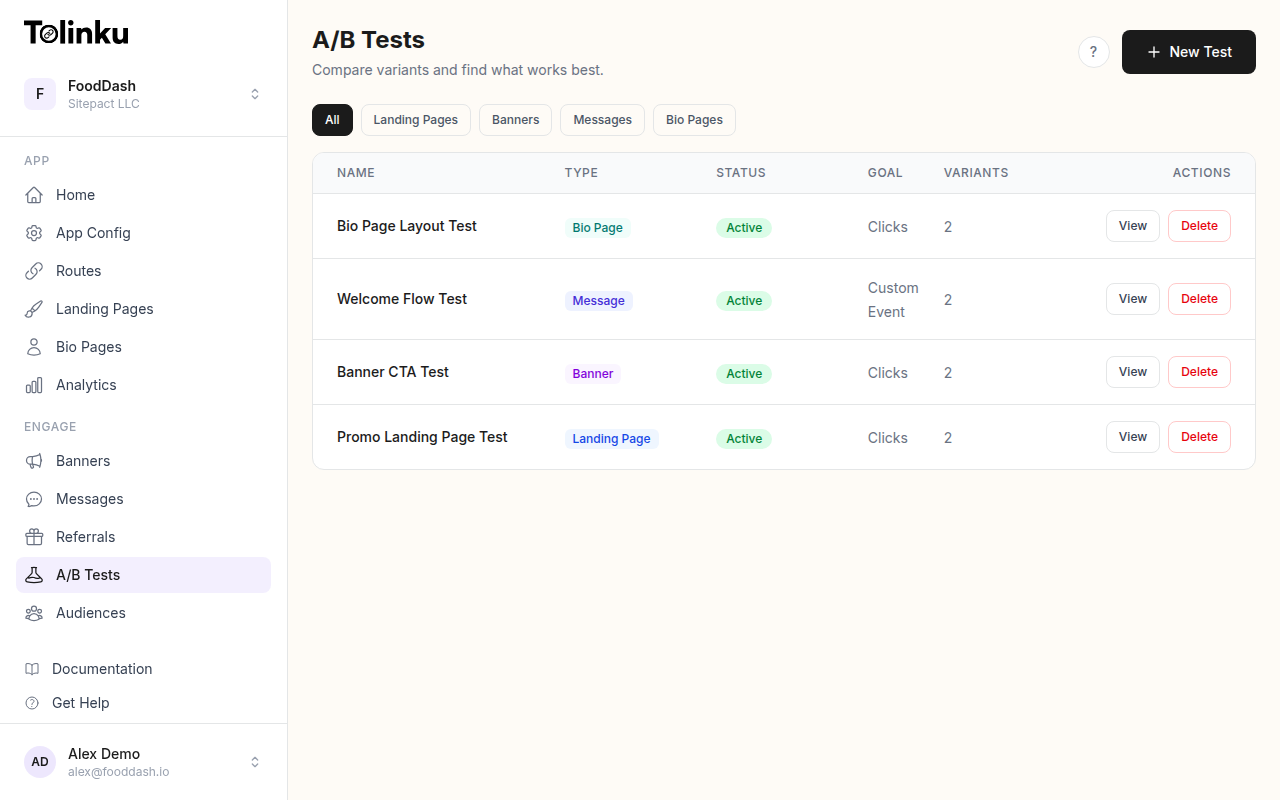 The A/B tests list page showing test names, status, types, and variant counts.
What to Test
1. Reward Amount
The most obvious variable. Test different reward values to find the sweet spot where cost per acquisition is lowest and referral volume is highest.
Test structure:
- Variant A: $5 for referrer, $5 for friend
- Variant B: $10 for referrer, $10 for friend
- Variant C: $15 for referrer, $10 for friend (asymmetric)
Doubling the reward doesn't double the referral rate. There's a diminishing return curve, and testing helps you find where it flattens. You might discover that $10 produces 80% of the referrals that $15 does, at 67% of the cost.
Configure reward values in your referral settings and split users into test groups at the account level.
2. Reward Type
Cash credit vs. free product vs. charitable donation vs. in-product perks. Different audiences respond to different incentive types.
Test structure:
- Variant A: $10 account credit
- Variant B: One month free
- Variant C: $10 donated to charity in the user's name
Research from the University of Chicago found that non-cash incentives can outperform cash when the recipient feels social pressure not to appear motivated by money. Charitable donations perform surprisingly well in some demographics.
3. Sharing Message
The pre-written message that accompanies the referral link when shared via text, email, or social media. Small changes in wording have outsized effects.
Test structure:
- Variant A: "I've been using [Product] and thought you'd like it. Here's $10 to get started: [link]"
- Variant B: "Hey, want to try [Product]? We both get $10: [link]"
- Variant C: "[Product] is offering $10 for new users. Grab it here: [link]"
Variant A leads with the personal recommendation. Variant B emphasizes the mutual benefit. Variant C removes the personal element entirely. Test which framing resonates with your user base.
4. Share Prompt Placement
Where in the app do you ask users to share? The timing and context matter more than most teams realize.
Common placements to test:
- After a successful transaction (emotional high point)
- In the settings/profile section (deliberate, low-friction)
- As a persistent banner or tab (always available)
- Post-onboarding (new user excitement)
- After a positive review or feedback moment
Test one placement at a time against a control (no prompt) to isolate the effect.
5. Qualifying Action
What does the referred friend need to do before the reward is triggered? This directly affects both conversion rate and user quality.
Test structure:
- Variant A: Reward on signup
- Variant B: Reward on first transaction
- Variant C: Reward after 30 days of activity
Variant A has the highest conversion rate but lowest user quality. Variant C has the lowest conversion rate but highest user quality. The optimal choice depends on your unit economics. See the referral reward strategies guide for more on reward triggers.
6. Referral Link Format
The link itself affects click-through rates. Test different formats:
- Short link:
go.yourapp.com/r/ABC123 - Vanity link:
go.yourapp.com/refer/sarah - Descriptive link:
go.yourapp.com/get-10-dollars
Vanity links (containing the referrer's name) tend to get higher click-through rates because they look more personal and less like spam.
Test Design
Randomization Unit
The randomization unit for referral tests should be the referrer, not the referred user. All referrals from a single user should see the same variant. If you randomize at the referral level, a single referrer could share links with different reward amounts, which creates confusion and erodes trust.
User A (assigned to Variant 1) → All of User A's referral links show $10 reward
User B (assigned to Variant 2) → All of User B's referral links show $15 reward
Sample Size
Referral tests need larger sample sizes than typical A/B tests because:
- Low base rates. Only 5-15% of users share a referral link. Of those who share, only 10-30% of their friends convert. You're measuring a percentage of a percentage.
- High variance. Some users refer 0 friends; others refer 50. This variance inflates the standard error.
- Multi-step funnel. You need statistical significance at each step: share rate, click rate, install rate, signup rate, qualifying action rate.
Use a sample size calculator with your current conversion rate and the minimum detectable effect you care about. For most referral programs, plan for at least 1,000 users per variant.
Test Duration
Run referral A/B tests for at least 2-4 weeks. Reasons:
- Day-of-week effects. Sharing behavior varies by day. Weekend referrals behave differently from weekday referrals.
- Delayed conversions. A friend might click the link on Monday, install on Wednesday, and make their first transaction on Friday. Short tests miss these delayed conversions.
- Novelty effects. A new reward amount might spike referrals temporarily as users react to the change. Wait for the novelty to wear off before drawing conclusions.
Measuring Results
Primary Metrics
| Metric | What It Measures | How to Calculate |
|---|---|---|
| Share rate | % of users who share at least once | Sharers / Total users in variant |
| Referral conversion rate | % of shared links that result in a qualified user | Qualified referrals / Total shares |
| Cost per referred user | Marketing cost of each referral | Total rewards paid / Qualified referrals |
| Referral LTV | Long-term value of referred users | Revenue from referred cohort over time |
Secondary Metrics
- Shares per referrer: Are users sharing more frequently in one variant?
- Click-through rate on shared links: Does the messaging variant affect how many friends click?
- Time to conversion: Does the qualifying action variant affect how quickly friends complete the action?
- Fraud rate: Does a higher reward attract more fraudulent referrals?
Use Tolinku analytics to track click and install metrics on referral links, and your internal analytics for downstream conversion metrics.
Statistical Significance
Don't call a test until you have 95% confidence (p < 0.05). For referral tests, this often takes longer than expected because of the low base rates and high variance mentioned above.
Use a Bayesian A/B testing calculator if you want to monitor results continuously without inflating your false positive rate from repeated significance testing.
Common Testing Mistakes
Testing too many things at once. If you change the reward amount, the messaging, and the placement simultaneously, you won't know which change drove the result. Test one variable at a time.
Ending tests too early. A test that shows a 20% lift after 3 days might show no difference after 3 weeks. The novelty effect is real, especially for reward changes.
Ignoring downstream metrics. A variant that doubles your referral rate is worthless if it also doubles your fraud rate or halves the LTV of referred users. Always track the full funnel.
Not accounting for network effects. If your test groups overlap socially (User A in Variant 1 refers User B, who is also in the test), the groups aren't truly independent. This is hard to avoid completely, but be aware of the contamination risk.
Testing on power referrers only. Your top 5% of referrers produce a disproportionate share of referrals, but they're not representative. Test on your full user base, then segment the results by referral volume to understand how the variant affects different user types.
A/B Testing Referral Deep Links
Use Tolinku A/B testing to test different referral link destinations. For example:
- Variant A: Referral link goes to your standard app store listing
- Variant B: Referral link goes to a custom referral landing page with social proof
The referral link uses deferred deep linking to preserve the referral attribution through the install process regardless of which landing page variant the friend sees.
You can also test the post-install experience for referred users:
- Variant A: Standard onboarding flow
- Variant B: Referral-specific onboarding that highlights the reward and the referrer's name
See the A/B testing documentation for setup details.
Testing Roadmap
If you're starting from scratch, test in this order:
- Reward amount (biggest impact on cost structure)
- Qualifying action (biggest impact on user quality)
- Share prompt placement (biggest impact on share rate)
- Sharing message (biggest impact on click-through rate)
- Reward type (once you've optimized the basics)
- Link format and landing page (refinement)
Each test builds on the previous winner. After 6 rounds, you'll have an optimized referral program that's backed by data, not guesses.
For the complete referral program framework, see building referral programs that actually work. For optimizing the referral landing page specifically, see the smart banner A/B testing guide.
Get deep linking tips in your inbox
One email per week. No spam.