Most growth metrics measure inputs or outputs in isolation. K-factor measures the relationship between them: for every user you acquire, how many additional users do they bring in? It is the closest thing mobile app growth has to a single number that captures whether your referral loops are working.
Understanding K-factor does not require a math background. The formula is simple, the interpretation is intuitive, and the levers for improving it are concrete. The harder part is instrumenting your data well enough to calculate it accurately.
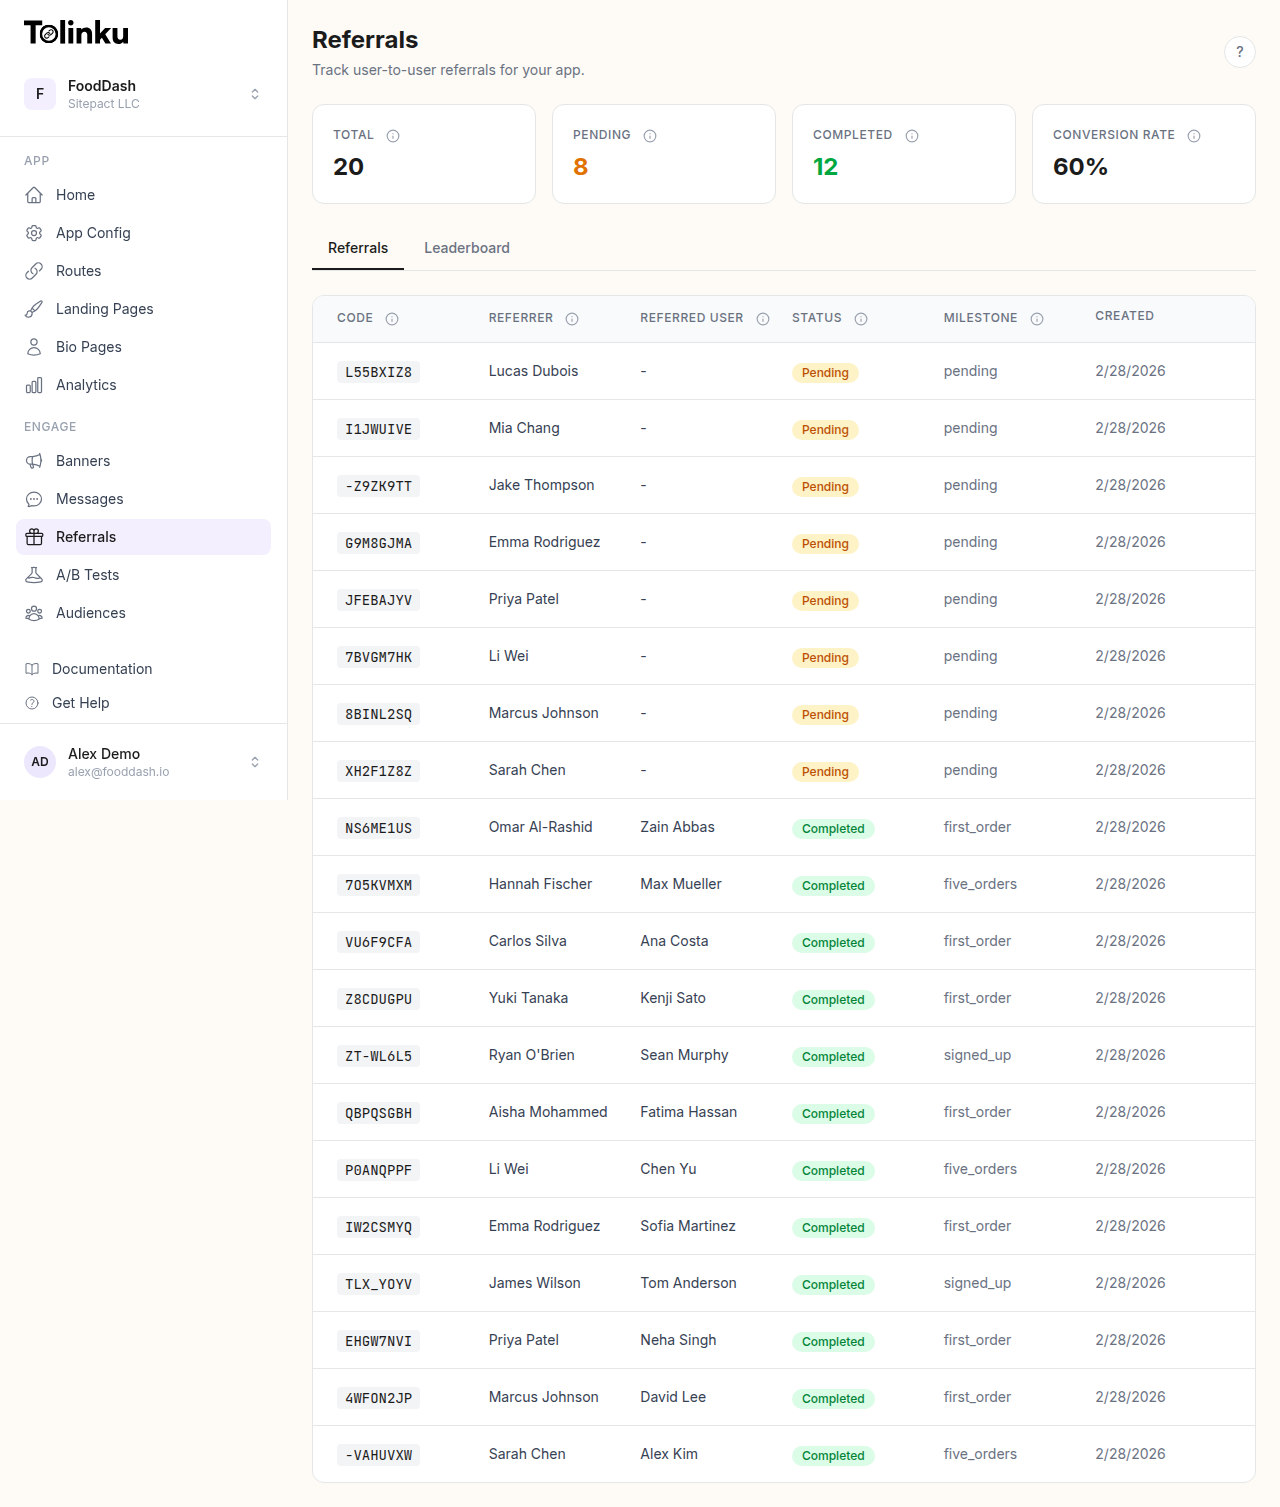 The referrals page with stats cards, referral list, and leaderboard tabs.
The K-Factor Formula
The viral coefficient K is calculated as:
K = i × c
Where:
- i is the number of invitations (or shares) sent by the average user
- c is the conversion rate on those invitations (the fraction who become users)
Example: if the average user sends 3 referral invites and 20% of those invites result in a new user, then:
K = 3 × 0.20 = 0.60
This formula was first applied to app growth by Andrew Chen, drawing on epidemiological models used to track disease spread. The "viral" terminology comes from the same math: a disease with a basic reproduction number (R0) greater than 1 spreads exponentially; a disease with R0 below 1 eventually dies out.
The same logic applies to referral programs. A K-factor above 1 means each new user generates more than one additional user on average, creating exponential growth. A K-factor below 1 means referrals add to your growth but do not sustain it independently.
What Different K Values Mean
K > 1: Viral growth
K above 1 is genuinely rare for sustained periods and should be interpreted carefully. It means your user base is growing exponentially from referrals alone, without any additional paid or organic acquisition. Mathematically, this is unsustainable as a permanent state (the addressable market is finite), but it describes what happens during explosive early growth phases.
A few companies have achieved K > 1 briefly: early Dropbox (with the storage-for-referrals mechanic), early Hotmail (with the forced "Get your free email at Hotmail" footer), and some consumer social apps in their initial virality window. These cases involved an extremely high-value incentive or a forced viral mechanism, not just a well-designed referral program.
If you see K > 1 in your data, first verify the calculation. K > 1 from a referral program with standard incentives usually indicates a measurement error or a fraud ring, not true virality.
K between 0.5 and 1: Strong referral engine
This is the realistic target range for most well-run referral programs. At K = 0.7, for every 100 users you acquire through other channels, your referral program generates an additional 70, then 49, then 34… the series converges but it adds up significantly over time.
At K = 0.7, a cohort of 1,000 acquired users generates approximately 2,333 total users (using the geometric series formula: 1000 / (1 – 0.7) = 3,333, minus the initial 1,000 from the denominator). That means your effective acquisition efficiency is 3.3x.
This range is achievable with a well-designed mobile referral program that has good placement, competitive rewards, and solid attribution. Many mobile app growth strategies treat a K between 0.5 and 0.8 as the practical ceiling for an organic referral program.
K between 0.1 and 0.5: Referrals contribute meaningfully
At this level, referrals are adding users but the program is not a major acquisition channel. The referral program may still be worthwhile if the cost per acquisition via referral is lower than other channels, even if the volume is modest.
A K of 0.15 means referrals add about 18% to your organic acquisition (100 / (1 – 0.15) = 117.6, so 17.6% lift). This is not transformative but it is real.
K below 0.1: Referrals are not working
Very low K values mean either very few users are sharing or almost nobody who receives an invite converts. Both are diagnosable problems. The section below on improving K covers the main levers.
How to Calculate K for Your App
To calculate K accurately, you need:
A defined cohort: Pick a time period (e.g., users acquired in January). You need a cohort with enough time to have completed referral cycles.
Total invites sent by cohort members: Sum all referral shares or invite sends from that cohort.
New users attributed to those invites: Sum all new users whose first install was attributed to a referral from the cohort.
Average invites per user (i): Total invites divided by cohort size.
Conversion rate (c): New users from referrals divided by total invites sent.
Then K = i × c.
A common mistake is calculating K from aggregate totals (all invites ever sent divided by all users) rather than cohort-based calculations. Aggregate calculations blend cohorts of different ages and obscure whether your program is improving or declining over time.
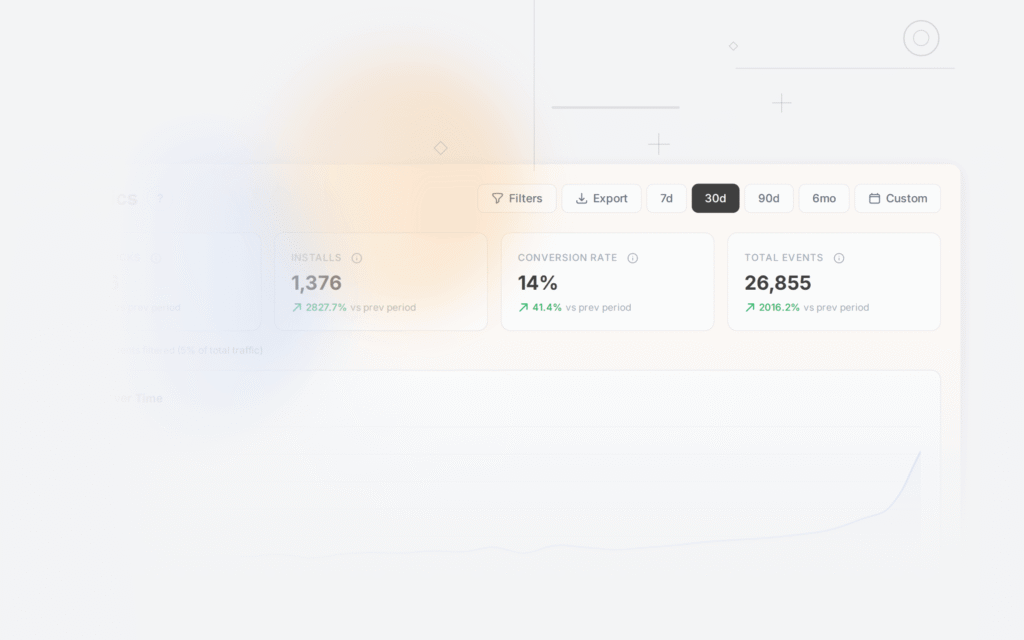
Tolinku's analytics dashboard tracks clicks and conversions per referral link. Combined with your app's event data (invite sends per user), you have the inputs for a cohort-based K calculation. The analytics documentation explains how to export attribution data.
The Viral Loop and Cycle Time
K-factor is one dimension of virality. The other is cycle time: how long it takes for one viral cycle to complete.
A viral cycle starts when a user sends an invite and ends when the invited user has gone through onboarding and sent their own invites. If your cycle time is 30 days and K = 0.6, your referral growth is slower than if your cycle time is 3 days and K = 0.6.
The compound growth formula for viral loops is:
Users after n cycles = Initial users × ((K^(n+1) – 1) / (K – 1))
Shortening cycle time has a multiplicative effect on growth. This is why onboarding speed matters for referral programs: a user who activates quickly sends invites sooner, which shortens the cycle.
Strategies to Increase K
Increase i: Get more users to share
The share rate (the percentage of users who actually send a referral invite) is almost always lower than it could be. Common reasons:
- The share prompt is hard to find
- The referral share UI requires too many taps
- The reward is not surfaced prominently enough
- The prompt appears at the wrong moment in the user journey
The highest-converting placement for the referral prompt is immediately after the user experiences their first clear win: a completed purchase, a completed task, a notable achievement. Timing the prompt to moments of peak satisfaction is the single biggest lever for increasing i.
Also consider the friction in the share flow itself. Every tap between "I want to share this" and "I just shared this" reduces conversion. The native share sheet (iOS
UIActivityViewController, AndroidACTION_SEND) minimizes friction by using familiar OS-level UI.Increase c: Get more referred users to convert
Conversion from referral click to active user depends on:
- The landing experience: Does clicking the link open the right place in the app? Does it deep link to a relevant product or page, or does it just open the home screen?
- The incentive clarity: Is the new user's reward immediately obvious?
- The install friction: How many steps are between tapping the link and getting to the app?
- The attribution reliability: Does the referral context survive the install process?
Deep links that land new users directly in the relevant context (a specific product, a welcome screen, a pre-filled checkout) consistently outperform generic app opens. Deferred deep linking makes this possible even when the user needs to install the app first.
If your click-to-install rate is acceptable but your install-to-action rate is low, the problem is in onboarding: users are installing but not completing the action that qualifies the referral. Shorten and clarify the onboarding flow, or move the qualifying action earlier (e.g., require account creation instead of first purchase for the referral to count).
Realistic Benchmarks for Mobile Apps
Industry data on K-factor across mobile app categories is sparse and often exaggerated. Based on publicly available case studies and industry analyses from sources like Andreessen Horowitz, First Round Review, and Reforge, realistic ranges are:
- Consumer social apps: K of 0.3-0.8 for well-designed referral programs
- E-commerce apps: K of 0.1-0.4 (higher cart value correlates with higher K)
- Subscription apps (SaaS, streaming): K of 0.05-0.3
- Fintech/banking apps: K of 0.1-0.5 (trust-based referrals, high conversion)
- Gaming apps: K of 0.2-0.6 (social mechanics built into gameplay)
These ranges assume a properly functioning referral program with tracked attribution, competitive rewards, and good placement. Most apps starting from scratch will be in the lower end of their category range until the program is optimized.
A K below your category benchmark is a signal that something specific is broken: attribution failures, low prompt exposure, unappealing rewards, or high install friction. A K above your benchmark suggests you have found a genuine competitive advantage in your referral mechanics.
K-Factor in Context
K-factor is a useful diagnostic tool, but it should not be the only metric you track for referral programs. A high K achieved through heavily discounted rewards may be unprofitable. A K calculated from a small sample cohort may not be statistically significant.
Pair K-factor with:
- Referral CAC: What does it actually cost to acquire a user through referrals once you account for reward costs and operational overhead?
- Referred user LTV: Do referred users stay longer and spend more than average? (They usually do, which makes referral economics better than K alone captures.)
- Organic multiplier: How much does your referral program amplify each dollar of paid acquisition?
For the full picture of building and measuring referral programs, see Building Referral Programs That Work and the Tolinku referrals documentation.
Get deep linking tips in your inbox
One email per week. No spam.