A single A/B test can lift conversion by 5%. Run twenty well-chosen tests in a year, and the compound effect is transformational. But here is what separates teams that see those compounding gains from teams that run tests sporadically: a roadmap.
Without a structured A/B testing roadmap, experimentation becomes reactive. Someone has a hunch, runs a test, gets a result, and moves on. There is no prioritization, no documentation, and no system for building on previous findings. The result is scattered effort and missed compounding opportunities.
A testing roadmap gives your team a shared plan for what to test, when to test it, and how to act on results. It turns experimentation from an occasional activity into a growth engine.
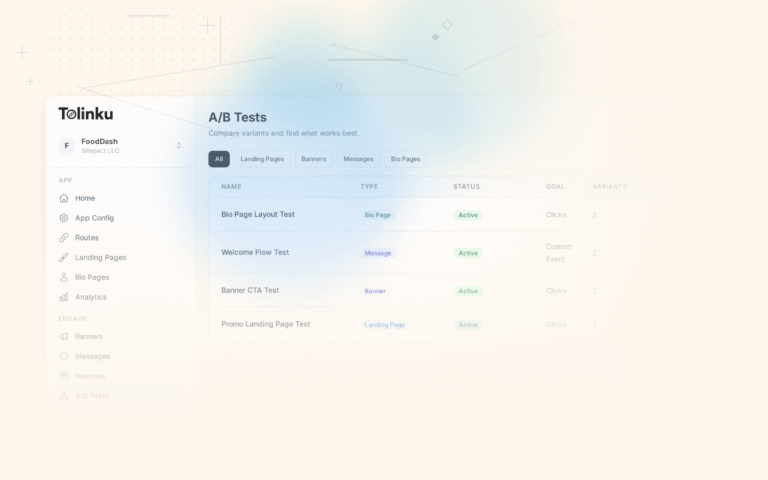
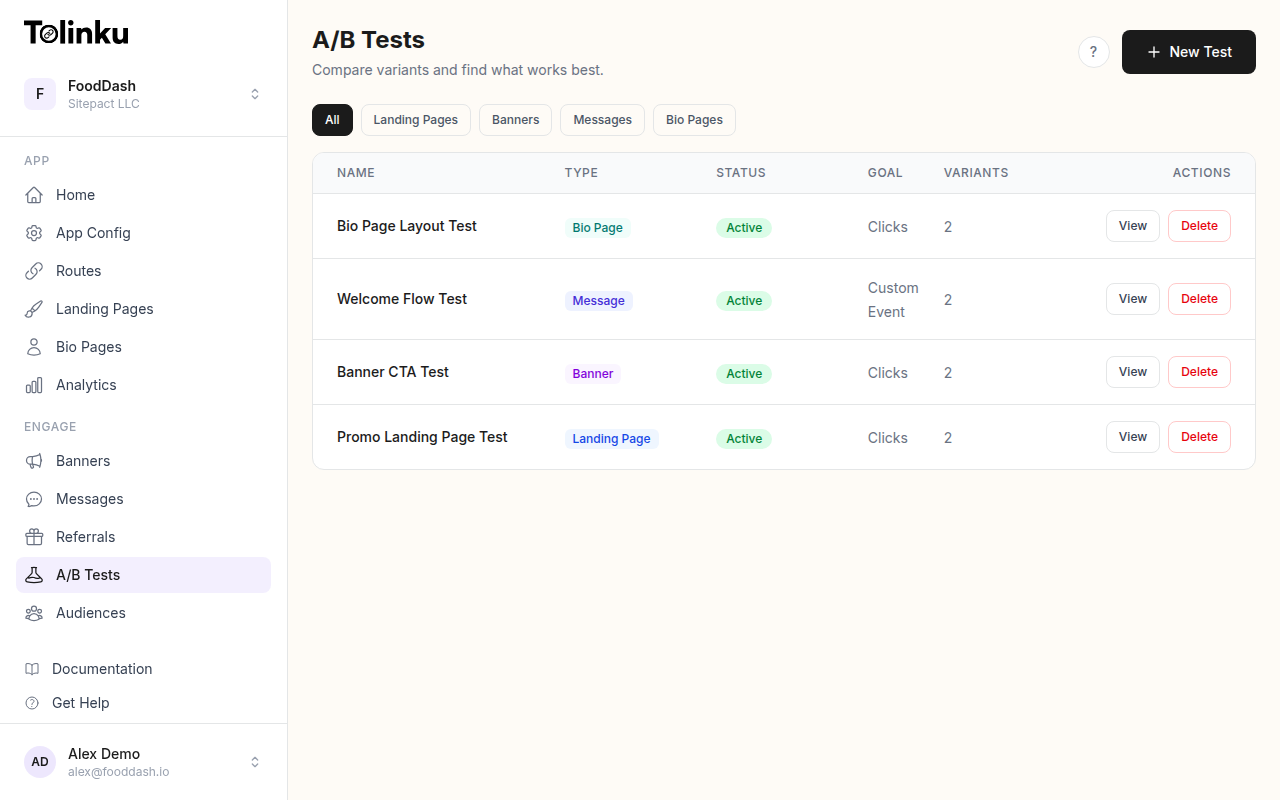 The A/B tests list page showing test names, status, types, and variant counts.
Why Ad-Hoc Testing Falls Short
Most teams start with ad-hoc testing. A product manager wants to try a new onboarding flow. A marketer suspects a different CTA would convert better. These are valid instincts, but without a roadmap they create problems:
- No prioritization. Tests compete for traffic and engineering time with no clear way to decide which runs first.
- No sequencing. Teams run tests in isolation instead of building on previous learnings. A test on deep link destinations might inform a follow-up test on landing page copy, but without a plan, that connection is lost.
- No capacity planning. Teams launch tests without checking whether they have enough traffic to reach statistical significance in a reasonable timeframe.
- No institutional memory. Results live in Slack threads and spreadsheets. Six months later, someone proposes a test that was already run.
A roadmap solves all four problems. It is a living document that keeps your experimentation program focused, sequential, and accountable.
Step 1: Build Your Test Backlog
Before you can prioritize, you need a list of potential tests. Start by auditing every touchpoint in your user journey and brainstorming hypotheses for each one. For a deep linking program, this includes:
- Link destinations. Which in-app screen should a campaign link open?
- Fallback pages. What do users without the app see?
- Banner messaging. What copy and CTA drive the most app opens?
- Onboarding flows. How should the first session differ for users who arrived via a deep link versus organic?
- Referral mechanics. What incentive structure generates the most shares?
Capture each idea as a structured backlog item. Here is a simple format you can use in a JSON file, a spreadsheet, or a project management tool:
{
  "backlog": [
    {
      "id": "TEST-001",
      "name": "Deep link destination: product page vs. category page",
      "hypothesis": "Sending campaign traffic directly to the product page will increase purchase rate by 15% compared to the category page.",
      "metric": "purchase_rate",
      "category": "quick-win",
      "ice_score": 8.0,
      "estimated_duration_days": 14,
      "min_sample_size": 5000,
      "status": "backlog",
      "dependencies": []
    },
    {
      "id": "TEST-002",
      "name": "Fallback landing page: single CTA vs. dual CTA",
      "hypothesis": "A single 'Install App' CTA will outperform a page offering both 'Install App' and 'Continue on Web' by reducing decision paralysis.",
      "metric": "app_install_rate",
      "category": "strategic-bet",
      "ice_score": 7.3,
      "estimated_duration_days": 21,
      "min_sample_size": 8000,
      "status": "backlog",
      "dependencies": []
    },
    {
      "id": "TEST-003",
      "name": "Smart banner copy: benefit-driven vs. action-driven",
      "hypothesis": "Benefit-driven copy ('See prices 40% lower in the app') will generate 20% more banner taps than action-driven copy ('Open in App').",
      "metric": "banner_tap_rate",
      "category": "quick-win",
      "ice_score": 8.7,
      "estimated_duration_days": 10,
      "min_sample_size": 3000,
      "status": "backlog",
      "dependencies": []
    }
  ]
}
Aim for 15 to 30 backlog items to start. You will not run them all at once, but having a deep backlog means you always know what to test next.
Step 2: Prioritize with ICE or PIE
A backlog without prioritization is just a wish list. Two widely used frameworks can help you rank tests objectively.
ICE Scoring assigns each test a score from 1 to 10 on three dimensions:
- Impact. How much will this move the target metric if the hypothesis is correct?
- Confidence. How confident are you that this will produce a measurable result (based on data, research, or past tests)?
- Ease. How easy is it to implement and run this test?
The ICE score is the average of all three. A test with Impact 9, Confidence 7, and Ease 8 scores 8.0.
PIE Scoring uses a similar structure but with different lenses:
- Potential. How much room for improvement exists on this page or flow?
- Importance. How much traffic or revenue does this touchpoint handle?
- Ease. Same as ICE.
Both frameworks work. Pick one and use it consistently. The value is not in the absolute scores; it is in forcing your team to evaluate tests against the same criteria instead of relying on whoever argues loudest.
Here is a helper function for calculating and sorting your backlog:
interface TestItem {
  id: string;
  name: string;
  impact: number;    // 1-10
  confidence: number; // 1-10
  ease: number;       // 1-10
  category: "quick-win" | "strategic-bet" | "infrastructure";
}

function prioritizeBacklog(tests: TestItem[]): TestItem[] {
  return tests
    .map(test => ({
      ...test,
      iceScore: (test.impact + test.confidence + test.ease) / 3
    }))
    .sort((a, b) => b.iceScore - a.iceScore);
}

// Quick wins (high ease, high confidence) go first in Q1.
// Strategic bets (high impact, lower confidence) get scheduled
// once you have learnings from quick wins.
Step 3: Categorize Your Tests
Not all tests serve the same purpose. Categorizing them helps you balance your roadmap across three types:
Quick wins are high-confidence, low-effort tests. Changing a CTA label, swapping a hero image, or testing a different deep link destination. These build momentum and generate early results. Aim to have 50-60% of your Q1 tests in this category.
Strategic bets are higher-effort experiments with bigger potential payoffs. Redesigning the fallback landing page, testing a completely different onboarding flow, or running a new referral incentive structure. These take longer to implement and require more traffic to validate. Schedule 2 to 3 per quarter.
Infrastructure tests improve your testing capability itself. Validating your analytics pipeline, confirming that your A/B testing setup is splitting traffic correctly, or establishing baseline metrics. These are especially important in Q1 when you are building your program.
Step 4: Plan Test Capacity
Your roadmap is constrained by traffic. Running too many concurrent tests dilutes your sample sizes and extends the time to statistical significance. Running too few wastes your traffic.
Calculate your weekly test capacity using this approach:
interface CapacityConfig {
  weeklyTraffic: number;
  maxConcurrentTests: number;
  targetSignificanceLevel: number;  // typically 0.95
  minimumDetectableEffect: number;  // e.g., 0.05 for 5% lift
}

function estimateTestDuration(
  sampleSizePerVariant: number,
  weeklyTraffic: number,
  concurrentTests: number
): number {
  const trafficPerTest = weeklyTraffic / concurrentTests;
  const trafficPerVariant = trafficPerTest / 2; // A/B split
  const weeksNeeded = Math.ceil(
    sampleSizePerVariant / trafficPerVariant
  );
  return weeksNeeded;
}

// Example: 20,000 weekly visitors, 2 concurrent tests
// Each test gets ~5,000 visitors/week per variant
// For a test needing 10,000 per variant: ~2 weeks
A practical rule of thumb: if a test needs more than 6 weeks to reach significance, consider whether you can narrow the audience, increase the minimum detectable effect, or run it during a high-traffic period. The Google Developers guide to sample sizing provides useful reference data for planning.
With Tolinku's A/B testing features, traffic splitting happens at the link level. This means you can run experiments on deep link destinations and fallback pages without any code changes to your app.
Step 5: Build the Quarterly Roadmap
Now assemble everything into a quarterly plan. Here is an example roadmap for Q3 of a deep link optimization program:
| Week | Test | Category | Metric | Min. Sample |
|---|---|---|---|---|
| 1-2 | Banner CTA copy: benefit vs. action | Quick win | Banner tap rate | 3,000 |
| 1-3 | Deep link destination: product vs. category | Quick win | Purchase rate | 5,000 |
| 3-4 | Fallback page: app store redirect timing | Quick win | Install rate | 4,000 |
| 4-7 | Landing page redesign: social proof variant | Strategic bet | Install rate | 8,000 |
| 5-6 | Referral link: personalized vs. generic preview | Quick win | Share rate | 3,500 |
| 7-10 | Onboarding flow: deep link context vs. standard | Strategic bet | Day-7 retention | 10,000 |
| 8-9 | Analytics pipeline validation | Infrastructure | Data accuracy | N/A |
| 10-12 | Re-test top Q2 winner with refined variant | Quick win | Varies | Varies |
Notice the structure. Quick wins run early and often. Strategic bets are staggered so they do not compete for traffic. Infrastructure work is scheduled mid-quarter. The final slot re-tests a previous winner; this is how you compound gains.
For more on designing the individual tests themselves, see A/B Testing Deep Links and Landing Pages.
Step 6: Document and Iterate
Every completed test should produce a written record that includes:
- Hypothesis. What you expected and why.
- Setup. Traffic split, variants, duration, sample size.
- Results. Primary metric, secondary metrics, statistical significance.
- Decision. Ship the winner, run a follow-up test, or discard.
- Learnings. What did this teach you about your users?
Store these in a shared location (a wiki, a Notion database, even a folder of markdown files). The goal is to prevent duplicate tests and to let new team members understand the history of your experimentation program.
Review results as a team at the end of each quarter. Look for patterns across tests. If three different experiments show that users prefer fewer choices, that is a design principle you can apply broadly, not just in the specific screens you tested.
Scaling Your Testing Program
As your program matures, expand in three directions:
Increase test velocity. Move from 2 concurrent tests to 3 or 4 as your traffic grows and your team gets faster at setting up experiments.
Expand the surface area. Start with deep link destinations and landing pages. Then move into push notification deep links, email deep links, referral flows, and in-app experiences. Each channel has its own set of testable variables.
Automate the pipeline. Build scripts that pull test results from your analytics platform, calculate significance, and flag tests that are ready for a decision. This reduces the manual overhead of managing a large backlog and lets you focus on designing better hypotheses.
The teams that grow fastest are not the ones with the best single test. They are the ones that run the most well-structured tests per quarter, learn from each one, and feed those learnings into the next cycle. A roadmap is what makes that cycle possible.
Getting Started Today
You do not need a large team or sophisticated tooling to start. Here is a minimal first step:
- List 10 hypotheses about your deep link and landing page performance.
- Score each one using ICE.
- Pick the top 3 and schedule them for the next 4 weeks.
- Set up traffic splitting in your Tolinku Appspace.
- Document results. Review. Repeat.
The first quarter is about building the habit. The second quarter is about compounding. By Q3, you will have a library of validated insights that no competitor can copy, because they are specific to your users, your product, and your growth model.
Get deep linking tips in your inbox
One email per week. No spam.