Your deep link platform retains 30 or 90 days of analytics data. Your data warehouse retains everything. When a stakeholder asks "how did our deep link performance change over the past year?" or "what is the lifetime value of users acquired through referral deep links in Q1?", you need historical data in a queryable format.
This guide covers data warehousing for deep link analytics. For data export, see exporting deep link analytics data. For API integration, see analytics API integration for deep links.
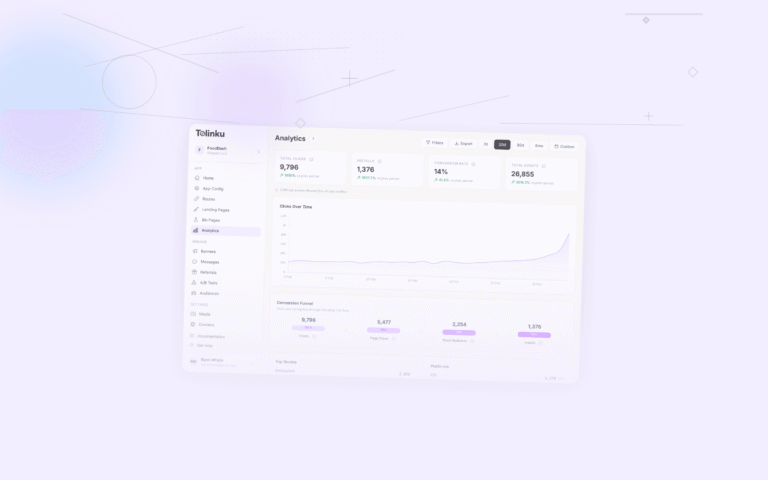
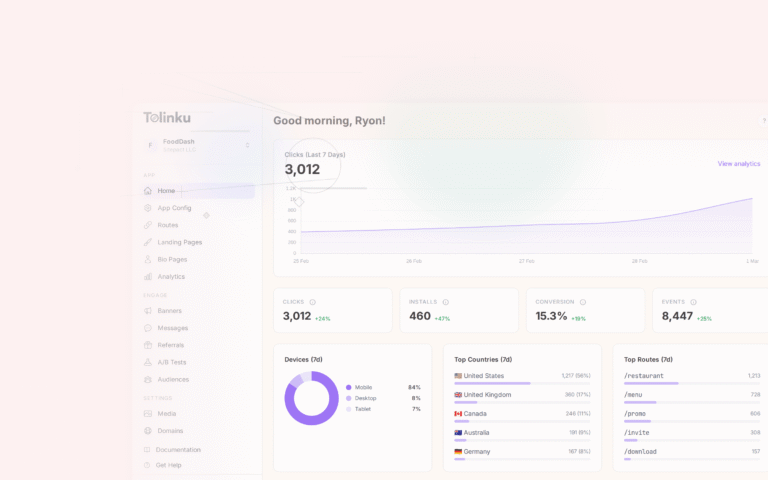
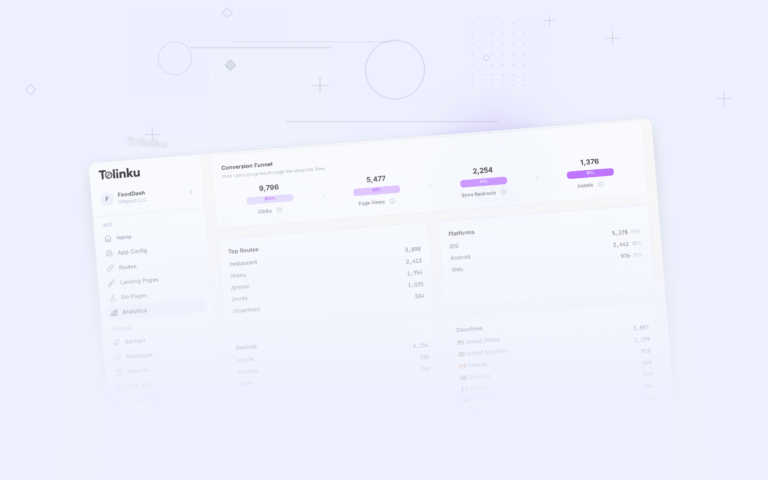
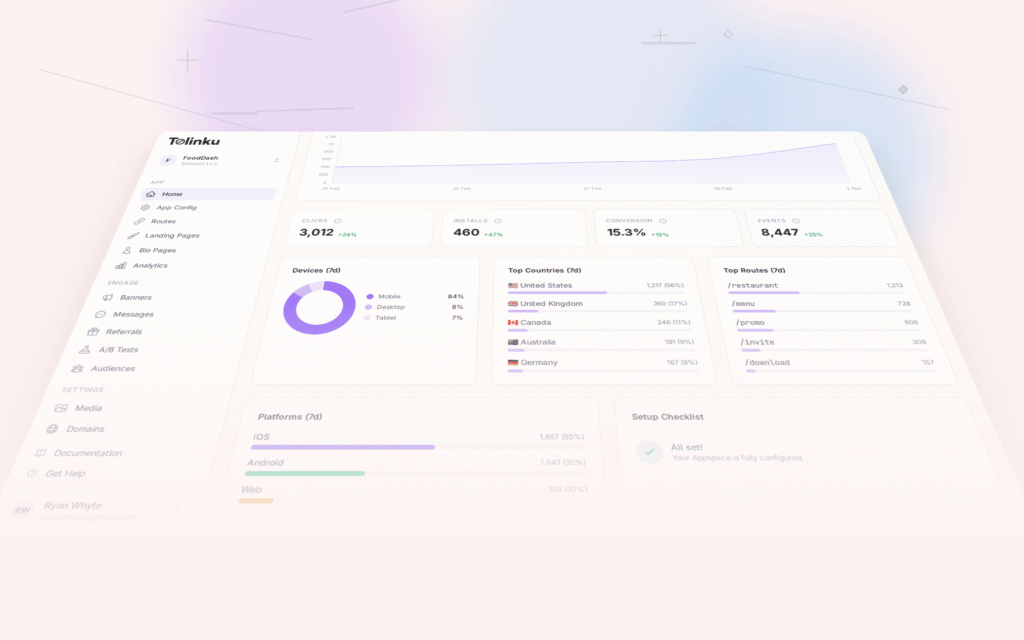
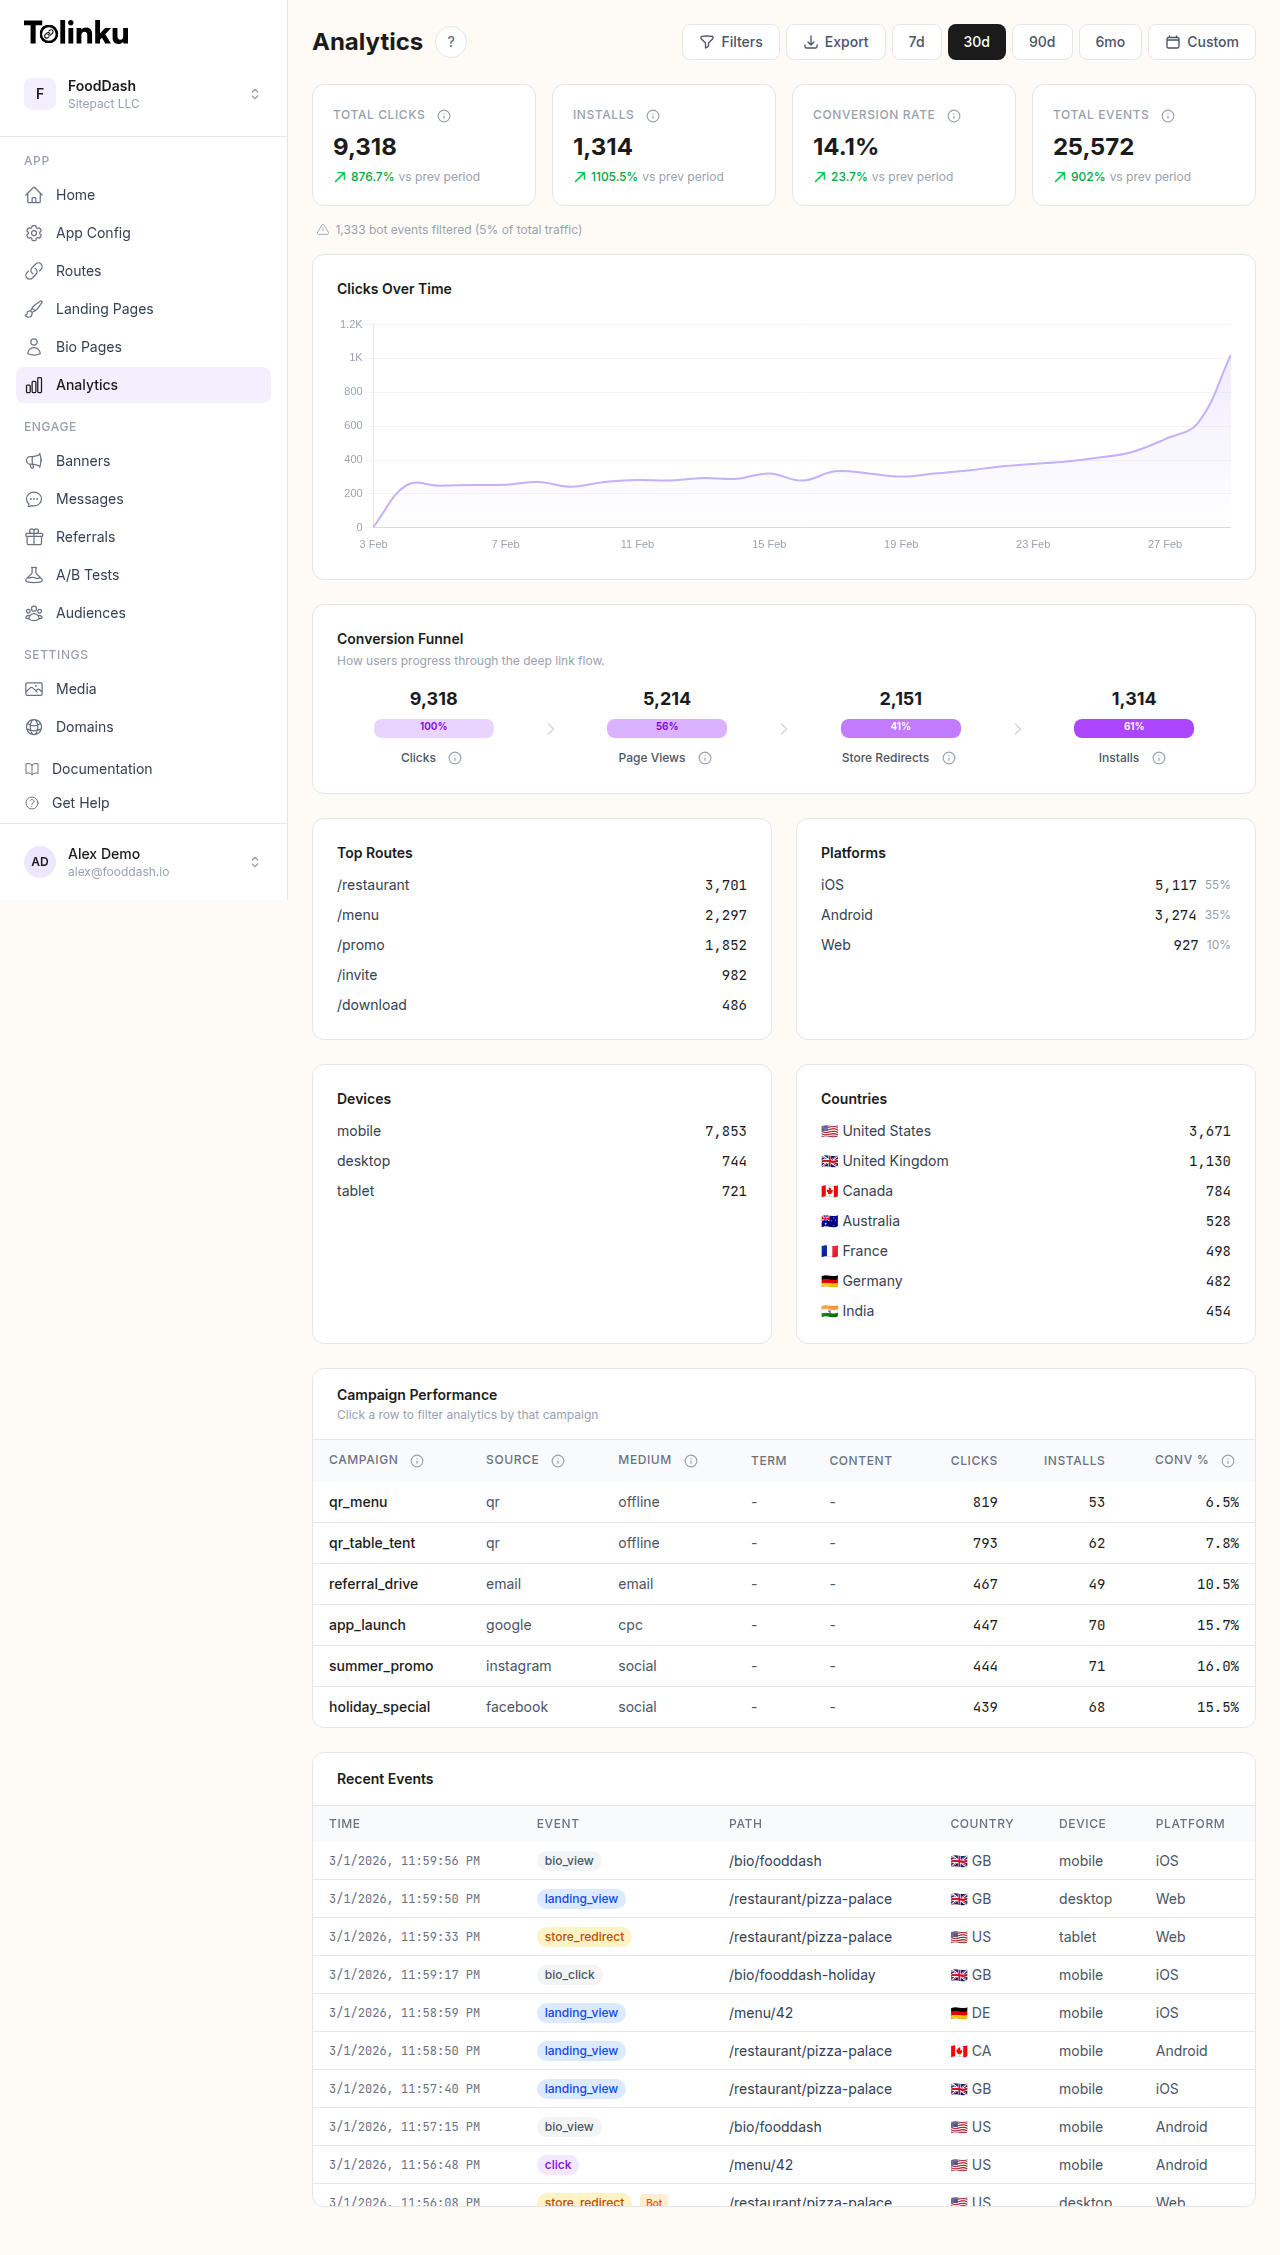 The analytics dashboard with date range selector, filters, charts, and breakdowns.
Why a Data Warehouse?
Limitations of Platform Analytics
| Limitation | Impact | Data Warehouse Solution |
|---|---|---|
| 30-90 day retention | Cannot analyze year-over-year trends | Unlimited retention |
| No cross-system joins | Cannot join clicks with revenue, CRM, or product data | Full SQL JOIN support |
| Limited query flexibility | Predefined dashboards only | Arbitrary SQL queries |
| No custom aggregations | Cannot build custom metrics | Define any metric via SQL |
| Rate-limited API | Cannot run intensive analysis | No rate limits on queries |
When You Need a Data Warehouse
- You want to analyze deep link data alongside revenue, CRM, or product data.
- You need more than 90 days of historical data.
- You want to build custom metrics and dimensions not available in the platform UI.
- You have data analysts or scientists who need raw data access.
- You want to use BI tools (Looker, Tableau, Metabase) for custom reporting.
Schema Design
Fact Table: Clicks
The primary fact table stores one row per deep link click:
CREATE TABLE fact_deep_link_clicks (
  click_id        VARCHAR(32) NOT NULL,
  timestamp       TIMESTAMP NOT NULL,
  date            DATE NOT NULL,              -- Partition key
  hour            SMALLINT NOT NULL,

  -- Deep link dimensions
  route           VARCHAR(256),
  route_pattern   VARCHAR(128),               -- e.g., /products/:id
  appspace_id     VARCHAR(32),

  -- Campaign dimensions
  source          VARCHAR(64),
  medium          VARCHAR(64),
  campaign        VARCHAR(128),
  content         VARCHAR(128),

  -- Device dimensions
  platform        VARCHAR(16),                -- ios, android, web
  os_version      VARCHAR(16),
  browser         VARCHAR(64),
  device_type     VARCHAR(16),                -- phone, tablet, desktop
  is_in_app       BOOLEAN,

  -- Geographic dimensions
  country         CHAR(2),
  region          VARCHAR(64),
  city            VARCHAR(128),

  -- Outcome
  outcome         VARCHAR(32),                -- app_opened, fallback, store_redirect, error
  latency_ms      INTEGER,
  error_code      VARCHAR(32),

  -- User (if available)
  anonymous_id    VARCHAR(64),
  user_id         VARCHAR(64),

  -- Deferred deep link
  is_deferred     BOOLEAN DEFAULT FALSE,
  deferred_matched BOOLEAN,

  PRIMARY KEY (click_id, date)
)
PARTITION BY RANGE (date);
Fact Table: Conversions
CREATE TABLE fact_deep_link_conversions (
  conversion_id   VARCHAR(32) NOT NULL,
  click_id        VARCHAR(32) NOT NULL,       -- FK to clicks
  timestamp       TIMESTAMP NOT NULL,
  date            DATE NOT NULL,

  conversion_type VARCHAR(64),                -- purchase, signup, feature_use
  revenue         DECIMAL(10, 2),
  currency        CHAR(3),

  -- Attribution
  attribution_window VARCHAR(16),             -- 1h, 24h, 7d, 30d
  is_first_touch  BOOLEAN,
  is_last_touch   BOOLEAN,

  PRIMARY KEY (conversion_id, date)
)
PARTITION BY RANGE (date);
Dimension Tables
CREATE TABLE dim_campaigns (
  campaign_id     VARCHAR(128) PRIMARY KEY,
  campaign_name   VARCHAR(256),
  start_date      DATE,
  end_date        DATE,
  budget          DECIMAL(10, 2),
  channel         VARCHAR(64),
  target_audience VARCHAR(128),
  status          VARCHAR(16)
);

CREATE TABLE dim_routes (
  route_pattern   VARCHAR(128) PRIMARY KEY,
  route_name      VARCHAR(256),
  category        VARCHAR(64),                -- product, offer, content, settings
  target_screen   VARCHAR(128),
  created_date    DATE
);
Materialized Views
Pre-aggregate common queries for fast dashboard loading:
-- Daily summary by campaign
CREATE MATERIALIZED VIEW mv_daily_campaign_summary AS
SELECT
  date,
  campaign,
  source,
  medium,
  platform,
  COUNT(*) AS clicks,
  SUM(CASE WHEN outcome = 'app_opened' THEN 1 ELSE 0 END) AS app_opens,
  SUM(CASE WHEN outcome = 'fallback' THEN 1 ELSE 0 END) AS fallbacks,
  SUM(CASE WHEN outcome = 'error' THEN 1 ELSE 0 END) AS errors,
  ROUND(AVG(latency_ms), 0) AS avg_latency_ms,
  COUNT(DISTINCT anonymous_id) AS unique_users
FROM fact_deep_link_clicks
GROUP BY date, campaign, source, medium, platform;

-- Daily summary by geography
CREATE MATERIALIZED VIEW mv_daily_geo_summary AS
SELECT
  date,
  country,
  platform,
  COUNT(*) AS clicks,
  SUM(CASE WHEN outcome = 'app_opened' THEN 1 ELSE 0 END) AS app_opens,
  ROUND(
    SUM(CASE WHEN outcome = 'app_opened' THEN 1 ELSE 0 END)::DECIMAL / COUNT(*) * 100, 1
  ) AS open_rate
FROM fact_deep_link_clicks
GROUP BY date, country, platform;
Warehouse Platforms
BigQuery (Google Cloud)
Good for: teams already on GCP, serverless (no infrastructure), pay-per-query pricing.
-- BigQuery-specific: Partitioned and clustered table
CREATE TABLE `project.analytics.deep_link_clicks`
(
  click_id STRING NOT NULL,
  timestamp TIMESTAMP NOT NULL,
  route STRING,
  source STRING,
  campaign STRING,
  platform STRING,
  country STRING,
  outcome STRING,
  latency_ms INT64
)
PARTITION BY DATE(timestamp)
CLUSTER BY campaign, platform, country;
Loading data:
# Load from Cloud Storage
bq load --source_format=NEWLINE_DELIMITED_JSON \
  analytics.deep_link_clicks \
  gs://analytics-bucket/clicks/2026-07-21/*.json
Snowflake
Good for: teams needing strong SQL compatibility, separate compute and storage scaling, data sharing.
-- Snowflake-specific: Micro-partitioned by default
CREATE TABLE analytics.deep_link_clicks (
  click_id VARCHAR(32) NOT NULL,
  timestamp TIMESTAMP_NTZ NOT NULL,
  route VARCHAR(256),
  source VARCHAR(64),
  campaign VARCHAR(128),
  platform VARCHAR(16),
  country CHAR(2),
  outcome VARCHAR(32),
  latency_ms INTEGER
)
CLUSTER BY (TO_DATE(timestamp), campaign);
Loading data:
-- Load from S3 stage
COPY INTO analytics.deep_link_clicks
FROM @s3_analytics_stage/clicks/
FILE_FORMAT = (TYPE = 'JSON')
MATCH_BY_COLUMN_NAME = CASE_INSENSITIVE;
Amazon Redshift
Good for: teams already on AWS, familiar with PostgreSQL, need tight integration with AWS services.
-- Redshift-specific: Distribution and sort keys
CREATE TABLE analytics.deep_link_clicks (
  click_id VARCHAR(32) NOT NULL,
  timestamp TIMESTAMP NOT NULL,
  route VARCHAR(256),
  source VARCHAR(64),
  campaign VARCHAR(128),
  platform VARCHAR(16),
  country CHAR(2),
  outcome VARCHAR(32),
  latency_ms INTEGER
)
DISTKEY(campaign)
SORTKEY(timestamp);
ETL Pipeline
Daily Load Pipeline
interface ETLConfig {
  source: {
    type: 'api' | 's3' | 'webhook';
    endpoint: string;
  };
  transform: {
    dedup: boolean;
    enrich: boolean;   // Add derived fields
    validate: boolean;
  };
  destination: {
    warehouse: 'bigquery' | 'snowflake' | 'redshift';
    table: string;
    writeMode: 'append' | 'merge';
  };
}

async function runDailyETL(config: ETLConfig, date: string) {
  // 1. Extract
  const rawData = await extractFromSource(config.source, date);
  console.log(`Extracted ${rawData.length} rows for ${date}`);

  // 2. Transform
  let transformed = rawData;

  if (config.transform.validate) {
    const { valid, invalid } = validateRows(transformed);
    transformed = valid;
    if (invalid.length > 0) {
      console.warn(`${invalid.length} invalid rows discarded`);
      await logInvalidRows(invalid, date);
    }
  }

  if (config.transform.dedup) {
    const before = transformed.length;
    transformed = deduplicateByClickId(transformed);
    console.log(`Deduped: ${before} → ${transformed.length}`);
  }

  if (config.transform.enrich) {
    transformed = transformed.map(row => ({
      ...row,
      date: row.timestamp.split('T')[0],
      hour: new Date(row.timestamp).getUTCHours(),
      route_pattern: extractRoutePattern(row.route),
      is_in_app: detectInAppBrowser(row.browser)
    }));
  }

  // 3. Load
  await loadToWarehouse(config.destination, transformed);
  console.log(`Loaded ${transformed.length} rows to ${config.destination.table}`);
}
Incremental vs Full Load
| Approach | Pros | Cons |
|---|---|---|
| Incremental (append new data daily) | Fast, low cost | May miss late-arriving data |
| Full refresh (reload all data) | Always complete | Slow, expensive for large tables |
| Merge (upsert) | Handles late data and updates | More complex queries |
For deep link analytics, incremental loading with a 3-day lookback handles most late-arriving data:
-- Merge pattern: load last 3 days, replace existing rows
MERGE INTO fact_deep_link_clicks target
USING staging_clicks source
ON target.click_id = source.click_id
WHEN MATCHED THEN UPDATE SET
  outcome = source.outcome,
  latency_ms = source.latency_ms
WHEN NOT MATCHED THEN INSERT (
  click_id, timestamp, date, route, source, campaign,
  platform, country, outcome, latency_ms
) VALUES (
  source.click_id, source.timestamp, source.date, source.route,
  source.source, source.campaign, source.platform, source.country,
  source.outcome, source.latency_ms
);
Query Patterns
Year-over-Year Comparison
SELECT
  DATE_TRUNC('month', date) AS month,
  COUNT(*) AS clicks,
  SUM(CASE WHEN outcome = 'app_opened' THEN 1 ELSE 0 END) AS app_opens,
  ROUND(
    SUM(CASE WHEN outcome = 'app_opened' THEN 1 ELSE 0 END)::DECIMAL / COUNT(*) * 100, 1
  ) AS open_rate
FROM fact_deep_link_clicks
WHERE date >= DATE_TRUNC('year', CURRENT_DATE) - INTERVAL '1 year'
GROUP BY month
ORDER BY month;
LTV by Acquisition Source
SELECT
  c.source,
  c.campaign,
  COUNT(DISTINCT c.user_id) AS users,
  ROUND(SUM(conv.revenue) / COUNT(DISTINCT c.user_id), 2) AS ltv,
  ROUND(AVG(conv.revenue), 2) AS avg_order_value,
  COUNT(conv.conversion_id) AS total_conversions
FROM fact_deep_link_clicks c
JOIN fact_deep_link_conversions conv ON c.click_id = conv.click_id
WHERE c.date >= '2026-01-01'
  AND c.is_deferred = FALSE
GROUP BY c.source, c.campaign
HAVING COUNT(DISTINCT c.user_id) >= 50
ORDER BY ltv DESC;
Cost and Storage
| Warehouse | Storage Cost | Query Cost | Notes |
|---|---|---|---|
| BigQuery | $0.02/GB/mo | $5/TB scanned | Partition pruning reduces cost |
| Snowflake | $23/TB/mo (compressed) | Credit-based | Separate compute scaling |
| Redshift | $0.25/GB/mo (RA3) | Included in instance cost | Reserved instances cheaper |
For a mid-size app generating 100K clicks/day, expect roughly 3GB/month of raw data, or 36GB/year. Storage costs are negligible; query costs depend on query frequency and complexity.
Tolinku for Data Warehousing
Tolinku's analytics support data export for warehouse loading. Export click data via the analytics API or the dashboard export. Load exported data into your warehouse on a daily schedule for long-term analysis and cross-system joins.
For data export, see exporting deep link analytics data. For analytics fundamentals, see deep link analytics: measuring what matters.
Get deep linking tips in your inbox
One email per week. No spam.