Built-in dashboards show you what happened. Exported data lets you figure out why. When you need to join deep link clicks with revenue data, run custom cohort models, or feed analytics into a BI tool, you need the raw data outside the platform.
This guide covers how to export deep link analytics data. For API-based integration, see analytics API integration for deep links. For understanding which metrics matter, see deep link analytics: measuring what matters.
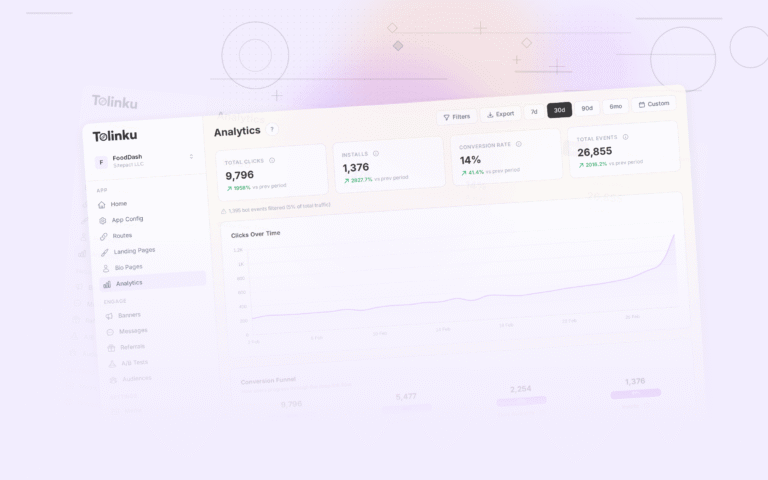
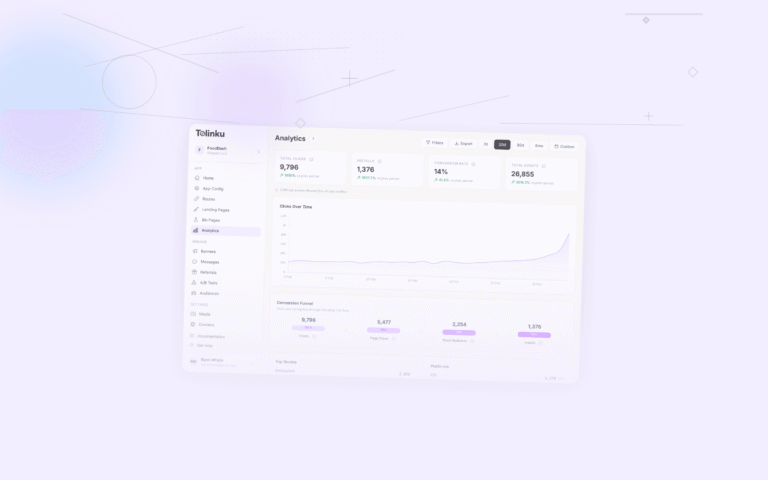
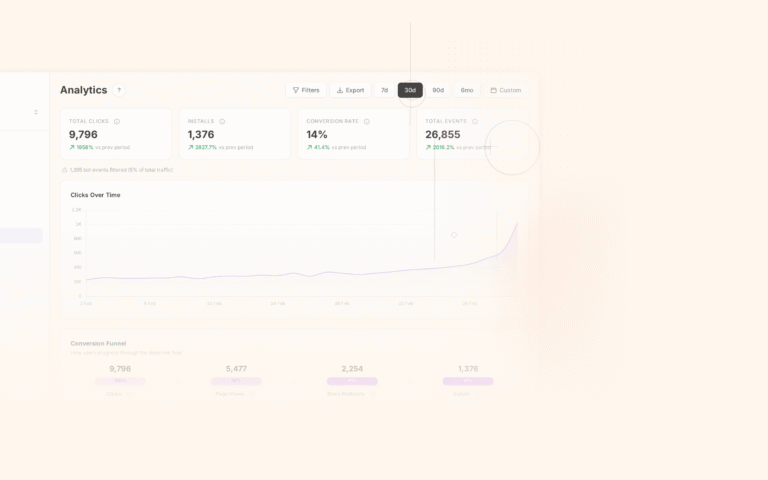
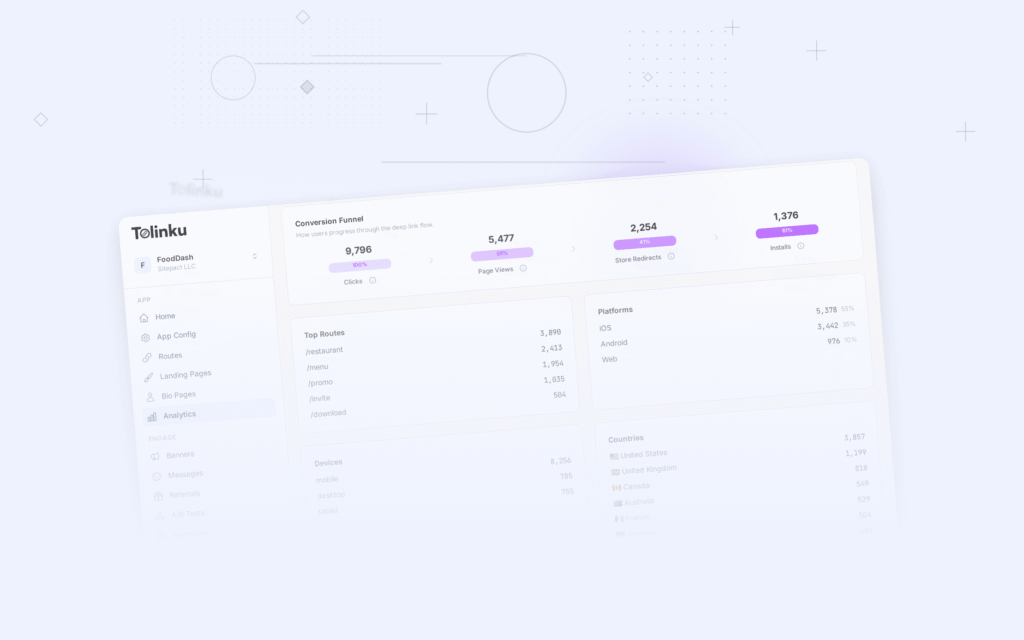
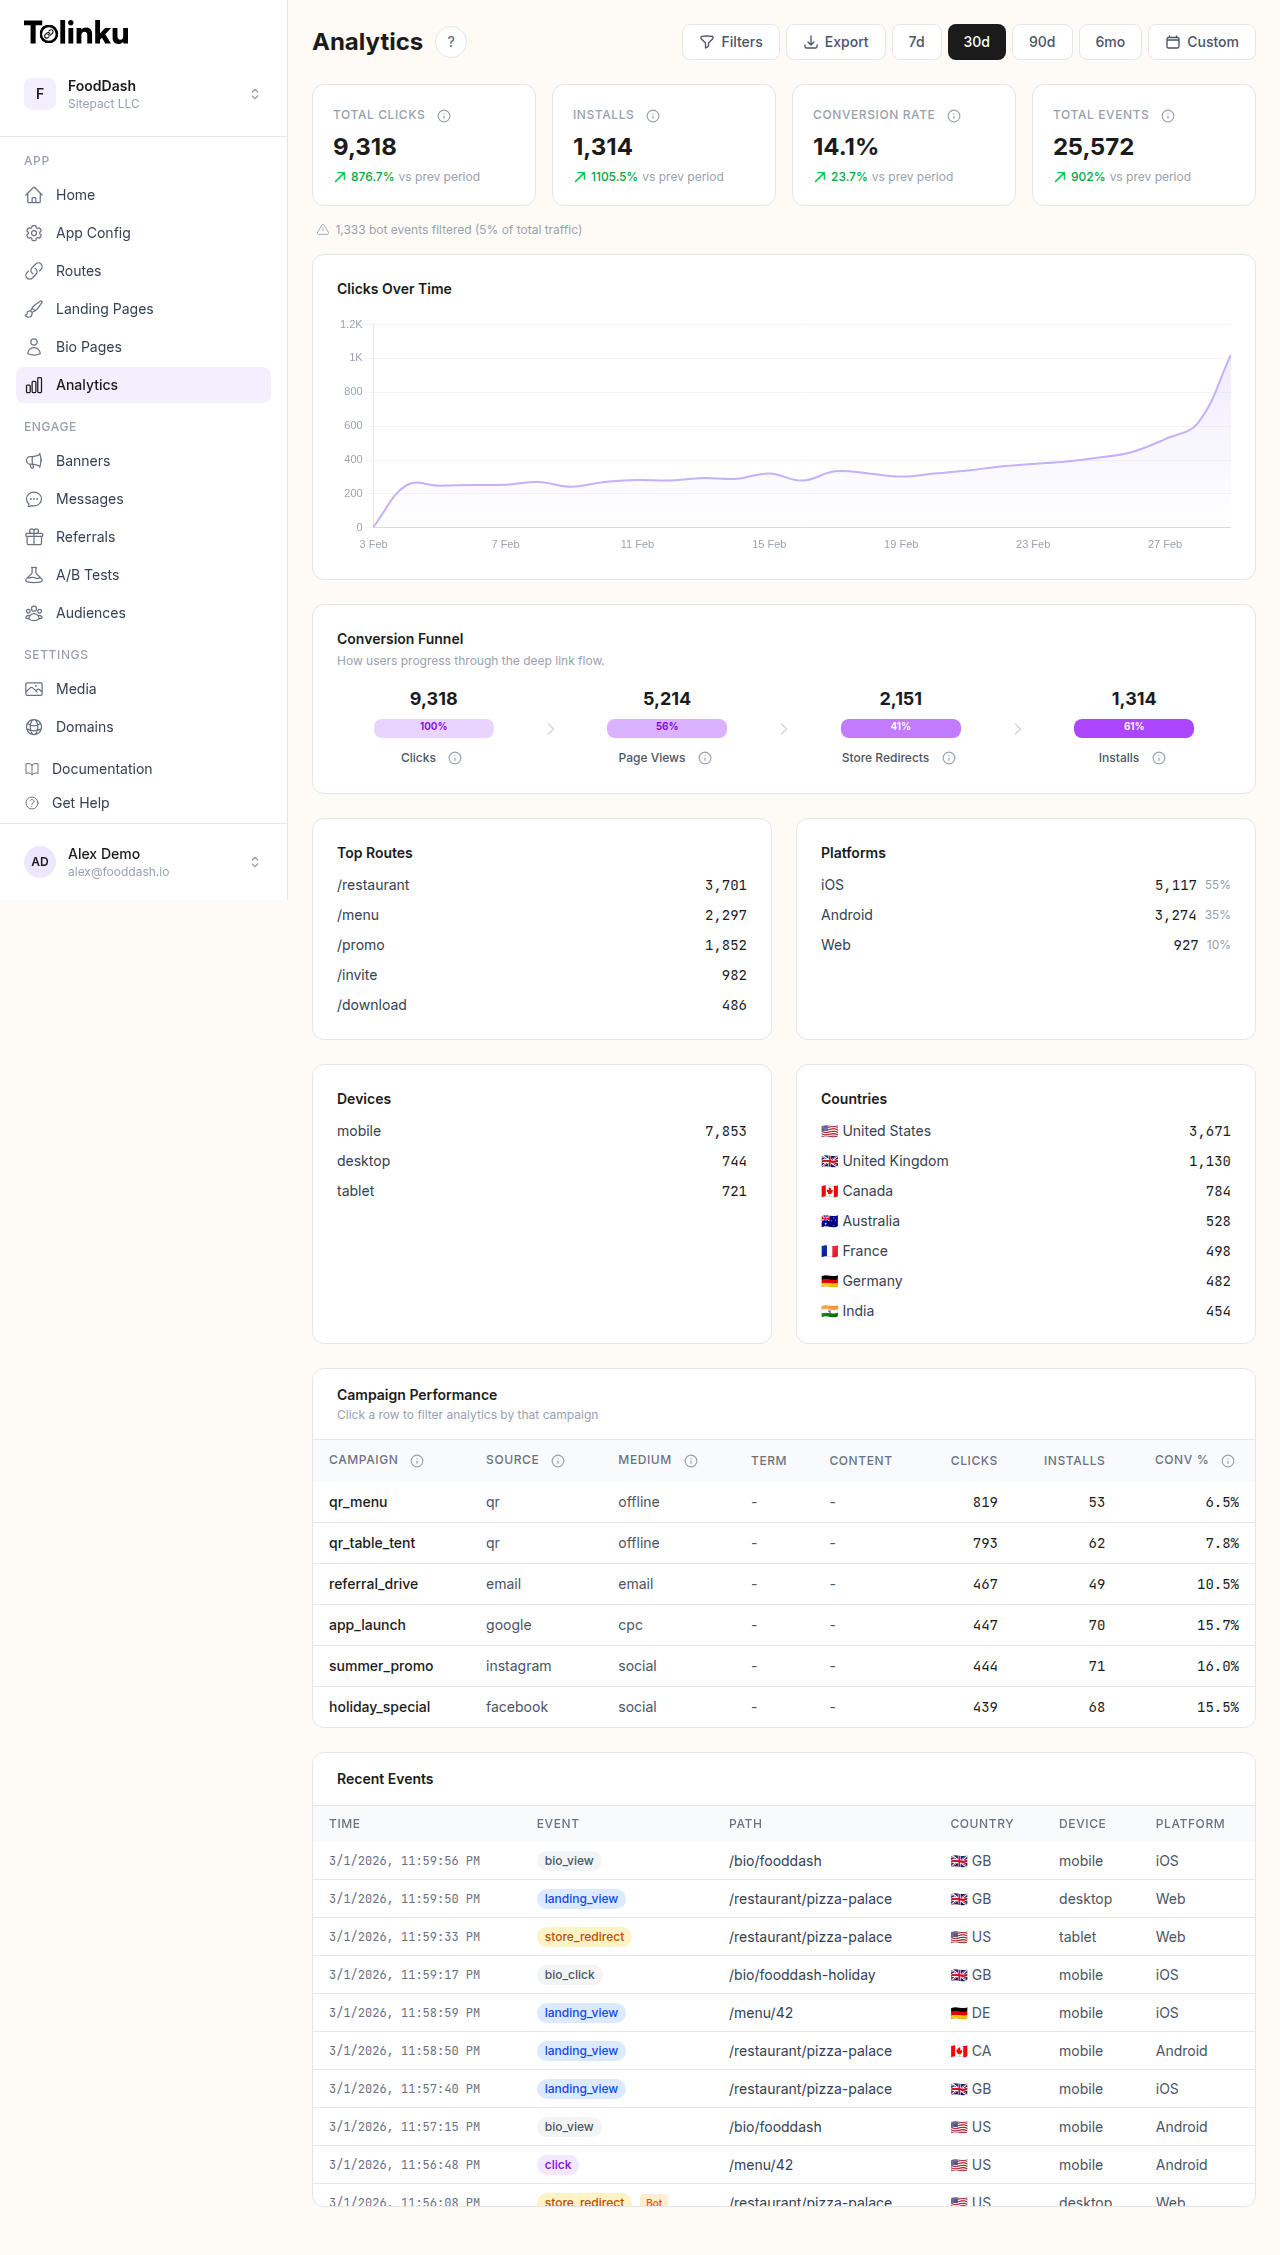 The analytics dashboard with date range selector, filters, charts, and breakdowns.
What Data to Export
Click-Level Data
Each deep link click generates a record with these fields:
| Field | Description | Example |
|---|---|---|
click_id |
Unique identifier | clk_a1b2c3d4 |
timestamp |
When the click occurred | 2026-07-19T14:32:00Z |
route |
The deep link route | /products/summer-sale |
source |
Traffic source | email |
medium |
Marketing medium | newsletter |
campaign |
Campaign name | july-promo |
platform |
User's platform | ios |
os_version |
Operating system version | 18.2 |
browser |
Browser or app | Safari |
country |
Country from IP geolocation | US |
city |
City from IP geolocation | San Francisco |
outcome |
What happened | app_opened |
latency_ms |
Time to resolve | 280 |
referrer |
HTTP referrer | https://mail.google.com |
Aggregated Data
For large-scale analysis, aggregated exports reduce file size:
| Aggregation | Use Case |
|---|---|
| By campaign + day | Campaign performance trends |
| By route + source | Which sources drive which content |
| By platform + country | Geographic and device segmentation |
| By hour of day | Timing optimization |
CSV Export
Manual Export
Most analytics platforms support CSV export from the dashboard. The export typically includes all visible columns plus any applied filters.
click_id,timestamp,route,source,medium,campaign,platform,country,outcome,latency_ms
clk_a1b2c3d4,2026-07-19T14:32:00Z,/products/summer-sale,email,newsletter,july-promo,ios,US,app_opened,280
clk_e5f6g7h8,2026-07-19T14:33:12Z,/offers/clearance,push,,retention-week2,android,UK,app_opened,350
clk_i9j0k1l2,2026-07-19T14:35:45Z,/products/summer-sale,social,organic,,ios,DE,fallback,420
Scheduled CSV Export
Automate exports on a schedule:
interface ExportConfig {
  schedule: 'daily' | 'weekly' | 'monthly';
  format: 'csv' | 'json' | 'parquet';
  destination: 'email' | 's3' | 'gcs' | 'sftp';
  filters: {
    campaigns?: string[];
    routes?: string[];
    platforms?: string[];
    dateRange?: { start: string; end: string };
  };
  columns: string[];
}

const dailyExport: ExportConfig = {
  schedule: 'daily',
  format: 'csv',
  destination: 's3',
  filters: {
    dateRange: { start: 'yesterday', end: 'yesterday' }
  },
  columns: [
    'click_id', 'timestamp', 'route', 'source',
    'medium', 'campaign', 'platform', 'country',
    'outcome', 'latency_ms'
  ]
};
CSV Pitfalls
- Large files. A million clicks per day produces CSV files over 100MB. Use date-range filters or switch to Parquet format for large datasets.
- Encoding. Ensure UTF-8 encoding, especially if campaign names or city names contain non-ASCII characters.
- Escaping. URLs in fields may contain commas. Use proper CSV quoting (RFC 4180).
- Timezone. Export timestamps in UTC. Convert to local time in your analysis tool, not in the export.
API Export
REST API Queries
Query analytics data programmatically for integration with custom tools:
async function fetchAnalytics(
  dateRange: { start: string; end: string },
  filters: Record<string, string>
): Promise<ClickData[]> {
  const params = new URLSearchParams({
    start: dateRange.start,
    end: dateRange.end,
    ...filters
  });

  const response = await fetch(
    `https://api.example.com/v1/analytics/clicks?${params}`,
    {
      headers: {
        'Authorization': `Bearer ${API_KEY}`,
        'Accept': 'application/json'
      }
    }
  );

  return response.json();
}
Pagination
Analytics APIs return paginated results. Handle pagination to get complete datasets:
async function fetchAllPages(
  endpoint: string,
  params: Record<string, string>
): Promise<any[]> {
  const allResults: any[] = [];
  let cursor: string | null = null;

  do {
    const queryParams = new URLSearchParams({
      ...params,
      limit: '1000',
      ...(cursor ? { cursor } : {})
    });

    const response = await fetch(`${endpoint}?${queryParams}`, {
      headers: { 'Authorization': `Bearer ${API_KEY}` }
    });

    const data = await response.json();
    allResults.push(...data.results);
    cursor = data.next_cursor;
  } while (cursor);

  return allResults;
}
Rate Limiting
Analytics APIs enforce rate limits to protect the service. Plan your exports accordingly:
| Approach | Rate Limit Impact | Best For |
|---|---|---|
| Real-time queries | High (many small requests) | Dashboards, alerts |
| Batch export (daily) | Low (one large request) | Reporting, data warehouse |
| Streaming (webhooks) | None (push-based) | Real-time processing |
Webhook Export
Event-Driven Export
Instead of pulling data, have the analytics platform push events to your endpoint:
// Webhook receiver
app.post('/webhooks/deep-link-clicks', (req, res) => {
  const event = req.body;

  // Validate webhook signature
  const signature = req.headers['x-webhook-signature'];
  if (!verifySignature(event, signature, WEBHOOK_SECRET)) {
    return res.status(401).json({ error: 'Invalid signature' });
  }

  // Process the event
  switch (event.type) {
    case 'click':
      processClick(event.data);
      break;
    case 'conversion':
      processConversion(event.data);
      break;
    case 'install':
      processInstall(event.data);
      break;
  }

  res.status(200).json({ received: true });
});
Webhook vs Batch Export
| Factor | Webhooks | Batch Export |
|---|---|---|
| Latency | Real-time (seconds) | Delayed (hours) |
| Completeness | May miss events if endpoint is down | Complete dataset |
| Ordering | Events may arrive out of order | Ordered by timestamp |
| Volume handling | Must handle bursts | Process at your pace |
| Backfill | Not supported | Re-export any date range |
Use webhooks for real-time reactions (fraud detection, instant notifications). Use batch export for analytics and reporting.
Data Warehouse Integration
Loading into a Data Warehouse
Once exported, load the data into your warehouse for joining with other business data:
-- BigQuery: Load from GCS
LOAD DATA INTO analytics.deep_link_clicks
FROM FILES (
  format = 'CSV',
  uris = ['gs://analytics-bucket/deep-link-clicks/2026-07-19.csv']
);

-- Snowflake: Load from S3
COPY INTO analytics.deep_link_clicks
FROM @s3_stage/deep-link-clicks/2026-07-19.csv
FILE_FORMAT = (TYPE = 'CSV' FIELD_DELIMITER = ',' SKIP_HEADER = 1);
Joining with Business Data
The real value of exported analytics is joining deep link data with business data:
-- Join deep link clicks with revenue data
SELECT
  dlc.campaign,
  dlc.source,
  COUNT(DISTINCT dlc.click_id) AS clicks,
  COUNT(DISTINCT o.order_id) AS orders,
  SUM(o.revenue) AS total_revenue,
  ROUND(SUM(o.revenue) / COUNT(DISTINCT dlc.click_id), 2) AS revenue_per_click
FROM deep_link_clicks dlc
LEFT JOIN orders o
  ON dlc.user_id = o.user_id
  AND o.order_date BETWEEN dlc.timestamp AND dlc.timestamp + INTERVAL '7 days'
WHERE dlc.timestamp >= '2026-07-01'
GROUP BY dlc.campaign, dlc.source
ORDER BY total_revenue DESC;
Schema Design
Design your analytics tables for query performance:
CREATE TABLE deep_link_clicks (
  click_id VARCHAR(32) PRIMARY KEY,
  timestamp TIMESTAMP NOT NULL,
  route VARCHAR(256),
  source VARCHAR(64),
  medium VARCHAR(64),
  campaign VARCHAR(128),
  platform VARCHAR(16),
  os_version VARCHAR(16),
  browser VARCHAR(64),
  country CHAR(2),
  city VARCHAR(128),
  outcome VARCHAR(32),
  latency_ms INTEGER,
  referrer VARCHAR(512),
  user_id VARCHAR(64),
  -- Partition by date for query performance
  date DATE GENERATED ALWAYS AS (CAST(timestamp AS DATE))
);

-- Index for common query patterns
CREATE INDEX idx_clicks_campaign_date ON deep_link_clicks (campaign, date);
CREATE INDEX idx_clicks_route_date ON deep_link_clicks (route, date);
CREATE INDEX idx_clicks_platform_country ON deep_link_clicks (platform, country);
Export Formats
CSV vs JSON vs Parquet
| Format | Size (1M rows) | Read Speed | Schema | Human Readable |
|---|---|---|---|---|
| CSV | ~150MB | Slow | No | Yes |
| JSON | ~300MB | Medium | Partial | Yes |
| Parquet | ~30MB | Fast | Yes | No |
- CSV: Universal compatibility. Good for small exports and Excel/Google Sheets analysis.
- JSON: Good for nested data (event properties, custom attributes). Larger file size.
- Parquet: Best for large datasets. Columnar format, compressed, typed. Use for data warehouse loading.
Automation Patterns
Daily ETL Pipeline
async function dailyETL() {
  const yesterday = getYesterday();

  // 1. Export from analytics platform
  const data = await fetchAnalytics({
    start: yesterday,
    end: yesterday
  }, {});

  // 2. Transform
  const transformed = data.map(row => ({
    ...row,
    date: row.timestamp.split('T')[0],
    hour: new Date(row.timestamp).getUTCHours(),
    is_app_open: row.outcome === 'app_opened' ? 1 : 0,
    is_conversion: row.outcome === 'converted' ? 1 : 0
  }));

  // 3. Load into warehouse
  await loadToWarehouse('deep_link_clicks', transformed);

  // 4. Refresh materialized views
  await refreshViews([
    'daily_campaign_summary',
    'weekly_route_performance',
    'monthly_platform_breakdown'
  ]);
}
Data Validation
Validate exported data before loading:
function validateExport(data: ClickData[]): ValidationResult {
  const errors: string[] = [];

  // Check for required fields
  const missing = data.filter(row =>
    !row.click_id || !row.timestamp || !row.outcome
  );
  if (missing.length > 0) {
    errors.push(`${missing.length} rows missing required fields`);
  }

  // Check for duplicate click IDs
  const ids = new Set<string>();
  const dupes = data.filter(row => {
    if (ids.has(row.click_id)) return true;
    ids.add(row.click_id);
    return false;
  });
  if (dupes.length > 0) {
    errors.push(`${dupes.length} duplicate click IDs`);
  }

  // Check timestamp range
  const outOfRange = data.filter(row => {
    const ts = new Date(row.timestamp);
    return ts > new Date() || ts < new Date('2020-01-01');
  });
  if (outOfRange.length > 0) {
    errors.push(`${outOfRange.length} rows with invalid timestamps`);
  }

  return {
    valid: errors.length === 0,
    errors,
    rowCount: data.length,
    dateRange: {
      min: data.reduce((min, r) => r.timestamp < min ? r.timestamp : min, data[0]?.timestamp),
      max: data.reduce((max, r) => r.timestamp > max ? r.timestamp : max, data[0]?.timestamp)
    }
  };
}
Tolinku for Data Export
Tolinku's analytics support data export through the dashboard and the analytics API. Export click data, campaign metrics, and conversion events. See the export documentation for available formats and filters.
For API-based analytics integration, see analytics API integration for deep links. For campaign reporting, see campaign performance reports for deep links.
Get deep linking tips in your inbox
One email per week. No spam.