Growth experimentation replaces guesswork with structured testing. Instead of debating whether a new onboarding flow or referral incentive will work, you run an experiment and let the data decide. This article covers how to build an experimentation framework for mobile app growth, from prioritization to analysis.
For A/B testing deep links specifically, see A/B testing deep links and landing pages. For growth metrics to track, see app growth metrics: the 15 KPIs that matter.
The Experimentation Process
Every growth experiment follows five steps:
- Hypothesize: Define what you expect to happen and why.
- Prioritize: Score the experiment against alternatives.
- Design: Set up the experiment with clear metrics and controls.
- Execute: Run the test for a statistically significant period.
- Analyze: Interpret results and decide next steps.
The discipline is in the process, not in having brilliant ideas. Most experiments fail. The teams that grow fastest are the ones that run the most experiments per week, not the ones with the best individual ideas.
Prioritization: ICE Scoring
With limited engineering and marketing resources, you cannot test everything. The ICE framework scores each experiment on three dimensions:
| Dimension | Question | Scale |
|---|---|---|
| Impact | If this works, how much will it move the target metric? | 1-10 |
| Confidence | How confident are you that it will work? (based on data, precedent, logic) | 1-10 |
| Ease | How easy is it to implement and run? | 1-10 |
ICE Score = Impact × Confidence × Ease
Example Backlog
| Experiment | Impact | Confidence | Ease | ICE Score |
|---|---|---|---|---|
| Simplify onboarding from 5 steps to 3 | 8 | 7 | 6 | 336 |
| Add referral bonus ($5 credit) | 7 | 6 | 8 | 336 |
| Test new App Store screenshots | 6 | 5 | 9 | 270 |
| Push notification at day-2 for lapsed users | 7 | 6 | 7 | 294 |
| Add social login (Google, Apple) | 6 | 8 | 4 | 192 |
| Redesign pricing page | 8 | 4 | 5 | 160 |
Run experiments in ICE score order. When two experiments tie, prefer the one with higher Ease (faster feedback).
Alternative: RICE Framework
Some teams prefer RICE, which adds Reach:
RICE Score = (Reach × Impact × Confidence) / Effort
Where Reach is the number of users affected per quarter. RICE is better for teams with large user bases where some experiments only affect a segment.
Designing Experiments
Hypothesis Format
Write hypotheses as testable statements:
If we [change], then [metric] will [improve/decrease] by [amount],
because [reason based on data or logic].
Examples:
- "If we reduce onboarding from 5 screens to 3, then day-1 retention will increase by 10%, because analytics show 40% of users drop off between screens 3 and 5."
- "If we add a referral prompt after the first completed workout, then referral sends per user will increase by 25%, because users are most motivated after achieving a goal."
Bad hypotheses:
- "Changing the button color will increase conversions." (No reasoning, no expected magnitude.)
- "Users will like the new design." (Not measurable.)
Defining Success Metrics
Every experiment needs:
| Component | Purpose | Example |
|---|---|---|
| Primary metric | The one metric that determines success or failure | Day-1 retention rate |
| Secondary metrics | Related metrics to watch for side effects | Day-7 retention, session length |
| Guardrail metrics | Metrics that must not degrade | Revenue per user, crash rate |
If the primary metric improves but a guardrail metric degrades, the experiment is not a success.
Sample Size and Duration
Running an experiment too briefly produces unreliable results. Use a sample size calculator to determine how many users you need:
| Baseline Rate | Minimum Detectable Effect | Required Sample (per variant) |
|---|---|---|
| 30% retention | 5% relative improvement | ~4,600 users |
| 10% conversion | 10% relative improvement | ~14,300 users |
| 2% referral rate | 20% relative improvement | ~19,000 users |
For most mobile apps, this means running experiments for 1-4 weeks. Do not stop experiments early because they "look good" or "look bad." Wait for statistical significance (typically 95% confidence).
Types of Growth Experiments
Acquisition Experiments
Testing how you attract new users:
| Experiment | Metric | Example |
|---|---|---|
| Ad creative variations | CPI, CTR | Test 3 different ad creatives on Meta |
| App Store screenshot order | Conversion rate | Rearrange screenshot sequence |
| Landing page copy | Install rate | Test benefit-focused vs feature-focused copy |
| Channel testing | CPI, Day-7 retention | Allocate $500 to TikTok ads |
| Deep link destination | Activation rate | Test landing on home vs specific content |
Activation Experiments
Testing how new users reach their "aha moment":
| Experiment | Metric | Example |
|---|---|---|
| Onboarding length | Completion rate, day-1 retention | 3 steps vs 5 steps |
| Permission request timing | Opt-in rate | Request push notification permission on day 1 vs day 3 |
| Tutorial format | Activation rate | Interactive tutorial vs video walkthrough |
| First-run experience | Day-1 retention | Guided setup vs free exploration |
Retention Experiments
Testing how you keep users coming back:
| Experiment | Metric | Example |
|---|---|---|
| Push notification timing | Open rate, day-7 retention | Morning vs evening notifications |
| Re-engagement email content | Reactivation rate | Personalized vs generic emails |
| Streak mechanics | Day-30 retention | Add daily streak counter |
| Feature discovery | Feature adoption rate | Tooltip tour vs discovery prompts |
Monetization Experiments
Testing how you convert users to revenue:
| Experiment | Metric | Example |
|---|---|---|
| Paywall placement | Conversion to paid | After feature use vs on startup |
| Pricing | Revenue per user | $4.99/month vs $9.99/month vs $49.99/year |
| Free trial length | Paid conversion rate | 7-day vs 14-day trial |
| Upgrade prompt copy | Tap rate | "Unlock all features" vs "Start your free trial" |
Running Experiments at Scale
Experiment Velocity
The most important growth metric is experiments per week. More experiments mean more learnings and more wins:
| Weekly Experiments | Typical Stage |
|---|---|
| 1-2 | Early-stage, small team |
| 3-5 | Growth-stage |
| 5-10 | Mature growth team |
| 10+ | Large growth team (multiple squads) |
To increase velocity:
- Reduce experiment scope (test one variable at a time).
- Pre-build reusable experiment infrastructure (feature flags, A/B testing framework).
- Run experiments in parallel across different parts of the funnel.
Experiment Documentation
Document every experiment in a shared log:
Experiment: Shortened onboarding (3 steps vs 5)
Date: 2026-01-15 to 2026-01-29
Hypothesis: Reducing onboarding from 5 to 3 steps will increase
            day-1 retention by 10% because 40% of users drop off
            between steps 3 and 5.
Variant A (control): 5-step onboarding
Variant B (test): 3-step onboarding
Sample size: 5,200 per variant
Result: Day-1 retention increased from 31% to 36% (+16% relative).
        Day-7 retention increased from 18% to 21% (+17% relative).
        Statistical significance: 98%.
Decision: Ship variant B to all users.
Learnings: Users who skip steps 4-5 in the old flow had higher
           retention than those who completed all 5. Those steps
           were adding friction without value.
This log becomes your team's institutional knowledge. New team members can read past experiments instead of re-running the same tests.
Common Mistakes
| Mistake | Impact | Fix |
|---|---|---|
| Stopping experiments early | False positives, wrong decisions | Commit to the sample size before starting |
| Testing too many variables at once | Cannot attribute results to a specific change | Test one variable per experiment |
| No control group | Cannot tell if changes are from the experiment or external factors | Always have a holdout control |
| Ignoring guardrail metrics | Winning on one metric while hurting another | Define guardrails before running |
| Not documenting learnings | Repeating failed experiments | Maintain a shared experiment log |
| Only testing big changes | Missing compounding small wins | Small improvements (2-5%) compound over time |
Tolinku for Experimentation
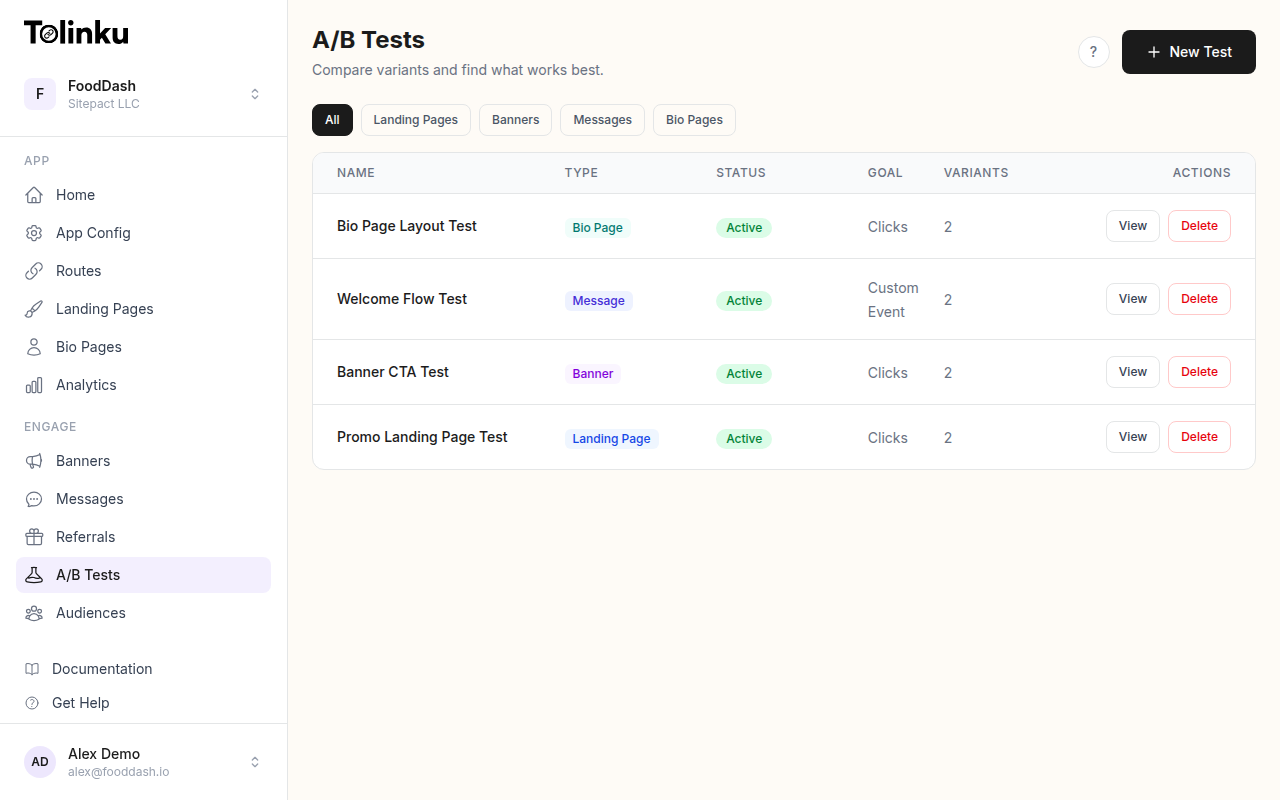 Tolinku's A/B testing dashboard for running experiments on deep link routes and landing pages.
Tolinku's A/B testing lets you run experiments on deep link routes and landing pages. Test different landing page templates, CTA copy, or routing logic (e.g., route 50% of link clicks to one in-app screen and 50% to another). Analytics track conversions per variant so you can measure which deep link experience drives the best activation.
For growth metrics to track, see app growth metrics: the 15 KPIs that matter. For the full growth guide, see mobile app growth: 25 strategies that work in 2026.
Get deep linking tips in your inbox
One email per week. No spam.