Acquiring a user who churns after one session costs money and produces nothing. Retention analytics tell you whether your deep links are bringing back users who stay, or users who bounce. The difference between a deep link that drives 60% Day 1 retention and one that drives 30% is the difference between a profitable channel and a money pit.
This guide covers retention analytics for deep links. For cohort analysis techniques, see cohort analysis for deep links: tracking user groups. For reducing churn, see reducing app churn: strategies that actually work.
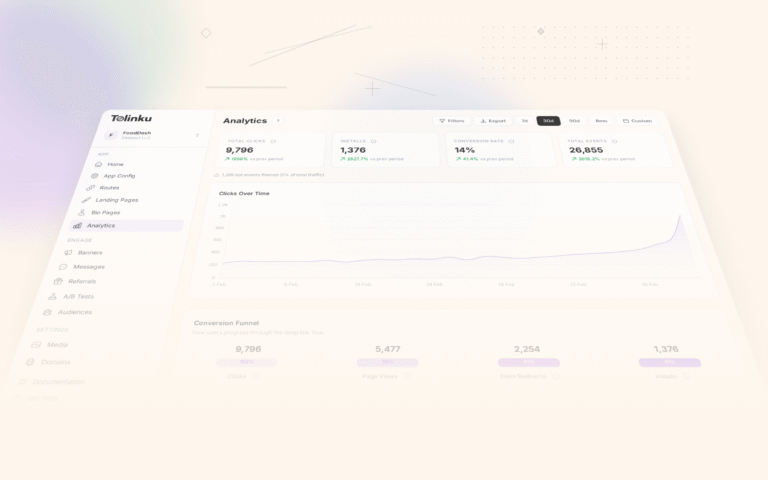
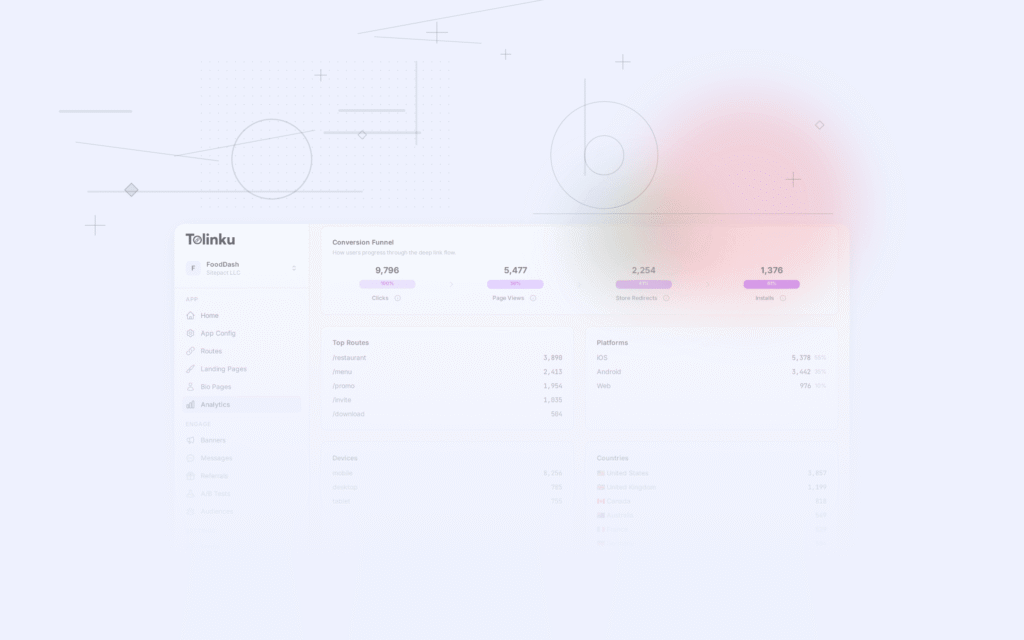
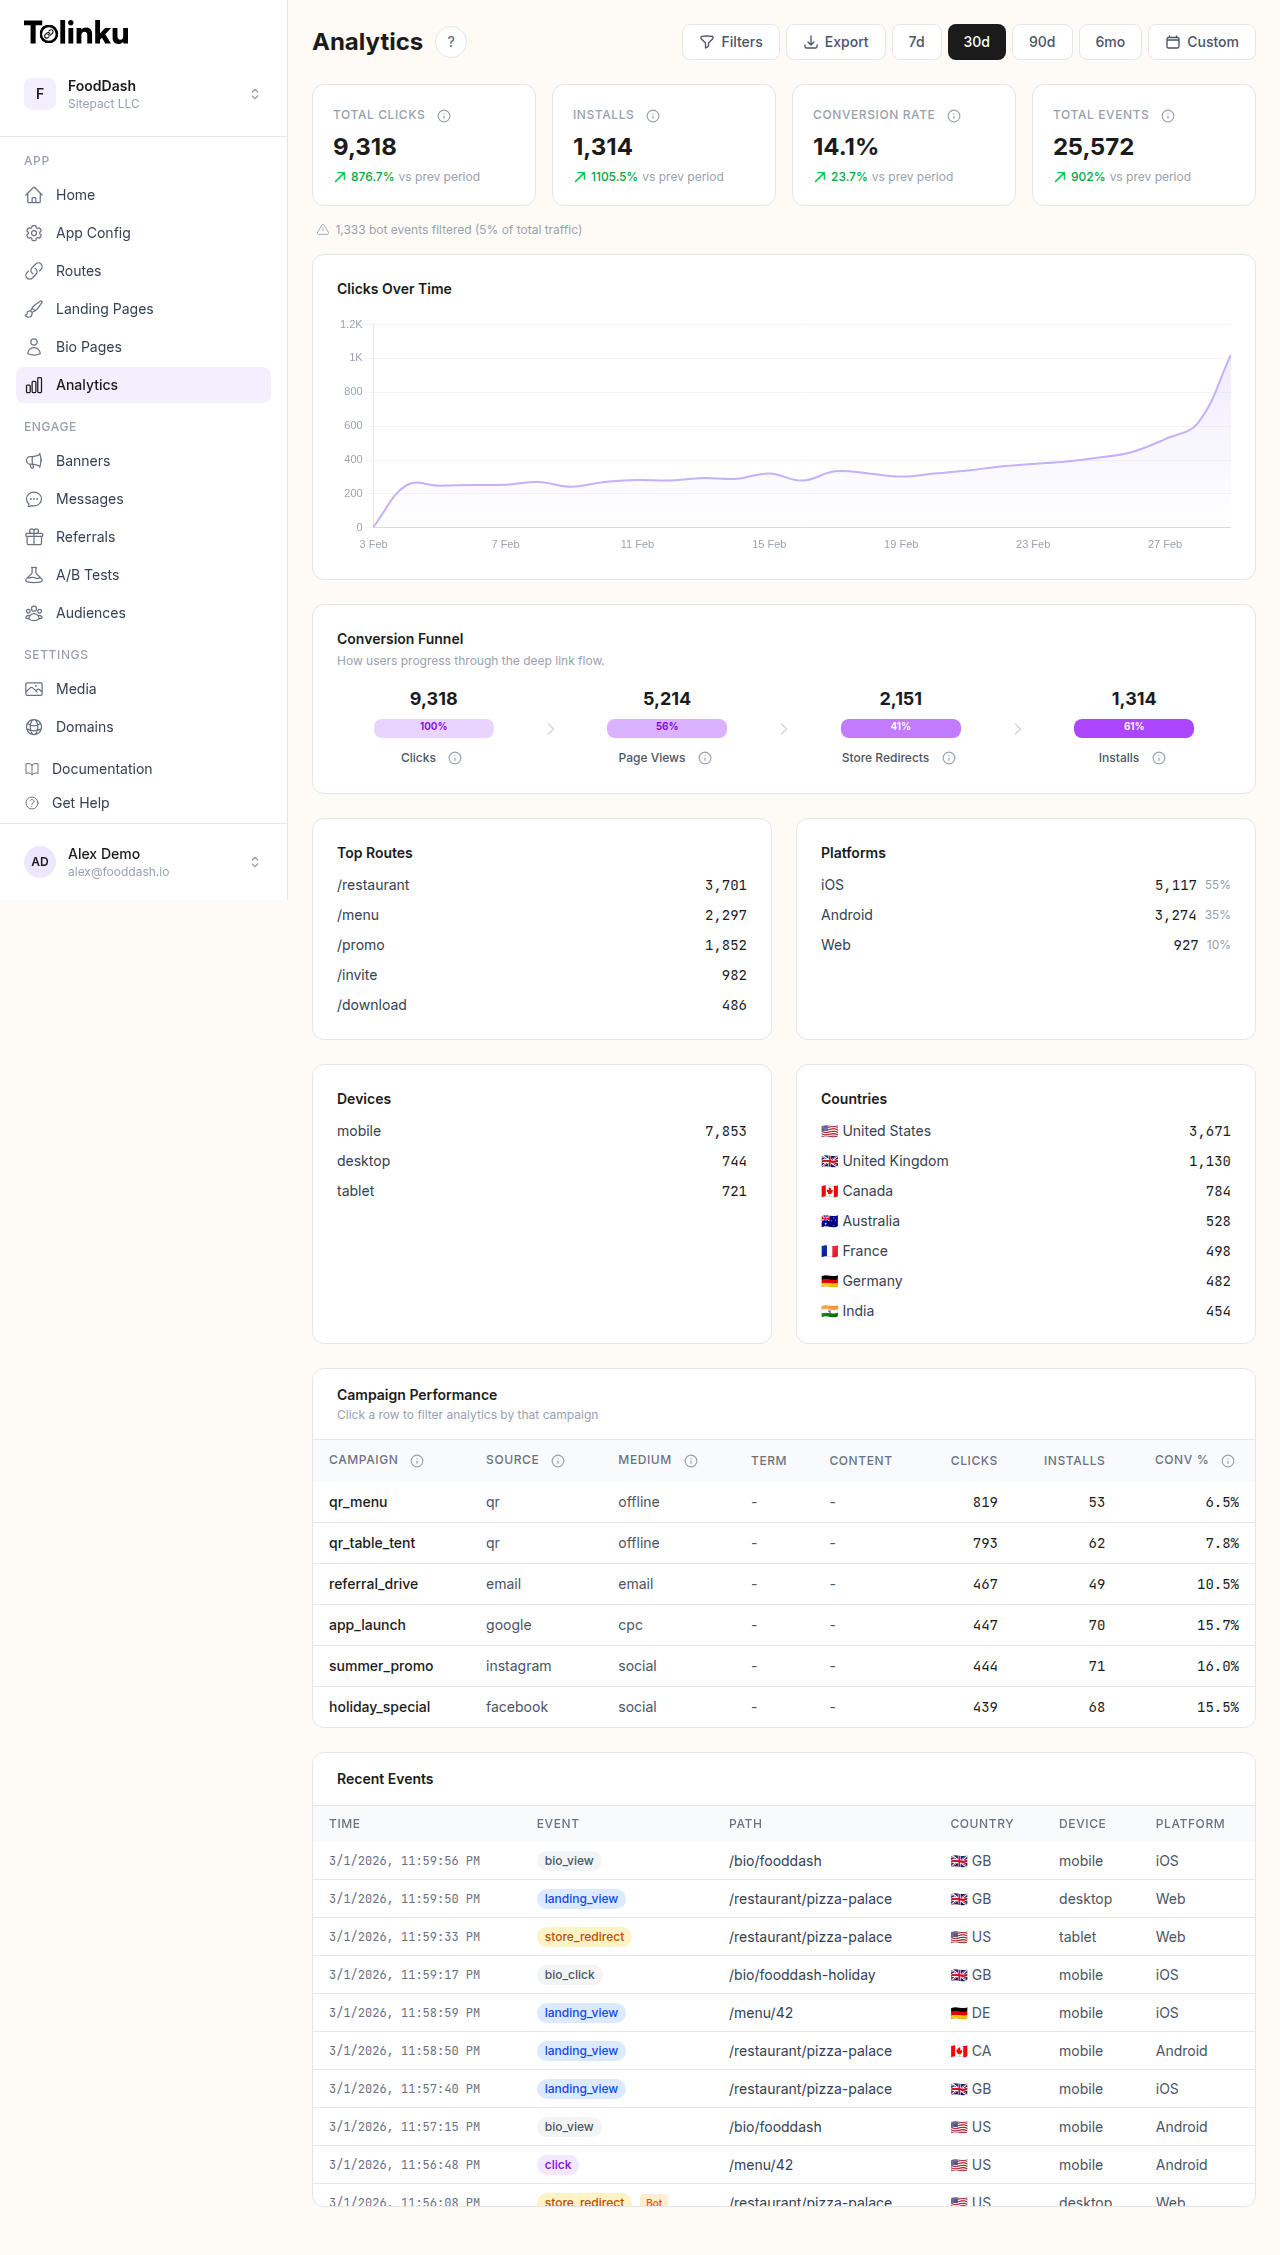 The analytics dashboard with date range selector, filters, charts, and breakdowns.
Retention Metrics
Standard Retention Intervals
| Metric | Definition | Good Benchmark |
|---|---|---|
| Day 1 retention | % of users who return 1 day after first open | 25-40% |
| Day 7 retention | % of users who return 7 days after first open | 10-20% |
| Day 14 retention | % of users who return 14 days after first open | 7-15% |
| Day 30 retention | % of users who return 30 days after first open | 5-12% |
| Day 90 retention | % of users who return 90 days after first open | 3-8% |
These benchmarks vary by app category. Social and messaging apps retain better than utilities. Gaming apps often have high Day 1 but steep drop-offs by Day 7.
Rolling Retention vs Classic Retention
Two ways to calculate retention:
- Classic retention (Day N): Did the user return on exactly Day N?
- Rolling retention (Day N+): Did the user return on Day N or any day after?
-- Classic Day 7 retention
SELECT
  cohort_date,
  COUNT(DISTINCT user_id) AS cohort_size,
  COUNT(DISTINCT CASE WHEN return_day = 7 THEN user_id END) AS returned_day_7,
  ROUND(
    COUNT(DISTINCT CASE WHEN return_day = 7 THEN user_id END)::DECIMAL /
    COUNT(DISTINCT user_id) * 100, 1
  ) AS day_7_retention
FROM (
  SELECT
    u.user_id,
    u.first_open_date AS cohort_date,
    EXTRACT(DAY FROM s.session_date - u.first_open_date) AS return_day
  FROM users u
  LEFT JOIN sessions s ON u.user_id = s.user_id
) sub
GROUP BY cohort_date;

-- Rolling Day 7+ retention
SELECT
  cohort_date,
  COUNT(DISTINCT user_id) AS cohort_size,
  COUNT(DISTINCT CASE WHEN return_day >= 7 THEN user_id END) AS returned_day_7_plus,
  ROUND(
    COUNT(DISTINCT CASE WHEN return_day >= 7 THEN user_id END)::DECIMAL /
    COUNT(DISTINCT user_id) * 100, 1
  ) AS day_7_plus_retention
FROM (
  SELECT
    u.user_id,
    u.first_open_date AS cohort_date,
    EXTRACT(DAY FROM s.session_date - u.first_open_date) AS return_day
  FROM users u
  LEFT JOIN sessions s ON u.user_id = s.user_id
) sub
GROUP BY cohort_date;
Rolling retention is more forgiving and generally produces higher numbers. Classic retention is stricter and better for detecting precise engagement patterns.
Deep Link vs Organic Retention
The Comparison
The core question: do users acquired through deep links retain better than users who find the app organically?
SELECT
  acquisition_source,
  COUNT(DISTINCT user_id) AS cohort_size,
  ROUND(COUNT(DISTINCT CASE WHEN return_day = 1 THEN user_id END)::DECIMAL /
    COUNT(DISTINCT user_id) * 100, 1) AS day_1,
  ROUND(COUNT(DISTINCT CASE WHEN return_day = 7 THEN user_id END)::DECIMAL /
    COUNT(DISTINCT user_id) * 100, 1) AS day_7,
  ROUND(COUNT(DISTINCT CASE WHEN return_day = 30 THEN user_id END)::DECIMAL /
    COUNT(DISTINCT user_id) * 100, 1) AS day_30
FROM (
  SELECT
    u.user_id,
    CASE
      WHEN u.first_deep_link IS NOT NULL THEN 'deep_link'
      ELSE 'organic'
    END AS acquisition_source,
    EXTRACT(DAY FROM s.session_date - u.first_open_date) AS return_day
  FROM users u
  LEFT JOIN sessions s ON u.user_id = s.user_id
  WHERE u.first_open_date >= '2026-06-01'
) sub
GROUP BY acquisition_source;
Typical results:
| Source | Cohort Size | Day 1 | Day 7 | Day 30 |
|---|---|---|---|---|
| Deep link | 5,200 | 42% | 22% | 14% |
| Organic | 3,800 | 28% | 15% | 8% |
Deep-linked users often retain 30-50% better because they arrived with intent. A user who clicked a link to a specific product, article, or feature already knows what they want. An organic install may have been driven by curiosity or an ad impression with no specific context.
Breaking Down by Deep Link Type
Not all deep links produce equal retention:
SELECT
  deep_link_type,
  COUNT(DISTINCT user_id) AS users,
  ROUND(COUNT(DISTINCT CASE WHEN return_day = 1 THEN user_id END)::DECIMAL /
    COUNT(DISTINCT user_id) * 100, 1) AS day_1,
  ROUND(COUNT(DISTINCT CASE WHEN return_day = 7 THEN user_id END)::DECIMAL /
    COUNT(DISTINCT user_id) * 100, 1) AS day_7
FROM retention_data
WHERE acquisition_source = 'deep_link'
GROUP BY deep_link_type
ORDER BY day_7 DESC;
| Deep Link Type | Users | Day 1 | Day 7 |
|---|---|---|---|
| Referral | 800 | 55% | 32% |
| Content (article/product) | 2,100 | 45% | 24% |
| Cart recovery | 900 | 38% | 18% |
| Re-engagement push | 1,200 | 35% | 15% |
| Generic campaign | 200 | 22% | 10% |
Referral deep links produce the highest retention because referred users have a social connection to the app. Content deep links also retain well because the user arrived at something specific and relevant.
Retention Curves
Building a Retention Curve
A retention curve plots retention rate against days since acquisition:
interface RetentionPoint {
  day: number;
  retentionRate: number;
  usersRetained: number;
  cohortSize: number;
}

async function buildRetentionCurve(
  cohort: { start: string; end: string },
  source?: string,
  maxDays: number = 30
): Promise<RetentionPoint[]> {
  const query = `
    SELECT
      return_day AS day,
      COUNT(DISTINCT user_id) AS users_retained
    FROM retention_data
    WHERE cohort_date BETWEEN ? AND ?
      ${source ? 'AND acquisition_source = ?' : ''}
      AND return_day BETWEEN 0 AND ?
    GROUP BY return_day
    ORDER BY return_day
  `;

  const params = source
    ? [cohort.start, cohort.end, source, maxDays]
    : [cohort.start, cohort.end, maxDays];

  const results = await db.query(query, params);
  const cohortSize = results.find(r => r.day === 0)?.users_retained || 0;

  return results.map(r => ({
    day: r.day,
    retentionRate: (r.users_retained / cohortSize) * 100,
    usersRetained: r.users_retained,
    cohortSize
  }));
}
Interpreting Retention Curves
A healthy retention curve flattens over time. If your curve keeps dropping without flattening, users are not finding long-term value.
| Curve Shape | What It Means |
|---|---|
| Steep drop, then flat | Normal. Most users churn early, but those who stay tend to stick. |
| Steady decline (no flattening) | Users never find the "aha moment." Product issue. |
| Drop then slight increase | Possible re-engagement campaigns artificially boosting later days. |
| Nearly flat from Day 1 | Very sticky product, or very small/biased cohort. |
Retention by Channel
Comparing Acquisition Channels
SELECT
  source,
  medium,
  COUNT(DISTINCT user_id) AS users,
  ROUND(COUNT(DISTINCT CASE WHEN return_day = 1 THEN user_id END)::DECIMAL /
    COUNT(DISTINCT user_id) * 100, 1) AS day_1,
  ROUND(COUNT(DISTINCT CASE WHEN return_day = 7 THEN user_id END)::DECIMAL /
    COUNT(DISTINCT user_id) * 100, 1) AS day_7,
  ROUND(COUNT(DISTINCT CASE WHEN return_day = 30 THEN user_id END)::DECIMAL /
    COUNT(DISTINCT user_id) * 100, 1) AS day_30
FROM retention_data
GROUP BY source, medium
ORDER BY day_30 DESC;
| Source | Medium | Users | Day 1 | Day 7 | Day 30 |
|---|---|---|---|---|---|
| referral | share | 800 | 55% | 32% | 20% |
| newsletter | 2,500 | 42% | 22% | 14% | |
| push | notification | 1,800 | 38% | 18% | 11% |
| social | organic | 600 | 30% | 14% | 7% |
| social | paid | 1,200 | 25% | 10% | 4% |
Paid social has the lowest retention because many users install out of impulse rather than genuine interest. Referral and email have the highest because users arrive with intent and context.
Optimizing Retention Through Deep Links
Onboarding Deep Links
The first session determines whether a user comes back. Deep links that land users on a high-value screen (personalized content, relevant product, social feed) retain better than those landing on a generic home screen.
function getOptimalLandingScreen(userContext: UserContext): string {
  // New user from referral: show the referrer's profile or shared content
  if (userContext.source === 'referral' && userContext.referrerId) {
    return `/users/${userContext.referrerId}/shared`;
  }

  // New user from product deep link: show the product
  if (userContext.route.startsWith('/products/')) {
    return userContext.route;
  }

  // New user with no context: personalized onboarding
  return '/onboarding/personalized';
}
Re-engagement Deep Links
For lapsed users, deep links to specific content outperform generic "come back" messages:
| Re-engagement Type | Return Rate | 7-Day Retention After Return |
|---|---|---|
| Generic push ("We miss you") | 5-8% | 15% |
| Content push (specific article/product) | 12-18% | 28% |
| Social push ("Friend posted…") | 15-22% | 35% |
| Incentive push ("20% off for you") | 18-25% | 20% |
Incentive pushes get clicks but produce low post-return retention because users grab the discount and leave. Social and content deep links produce better sustained engagement.
Timing Re-engagement
When to send re-engagement deep links matters:
-- Find the optimal re-engagement window
SELECT
  days_since_last_session,
  COUNT(*) AS reengagement_attempts,
  SUM(CASE WHEN returned THEN 1 ELSE 0 END) AS returned,
  ROUND(SUM(CASE WHEN returned THEN 1 ELSE 0 END)::DECIMAL / COUNT(*) * 100, 1) AS return_rate,
  ROUND(AVG(CASE WHEN returned THEN day_7_retained END) * 100, 1) AS day_7_after_return
FROM reengagement_events
GROUP BY days_since_last_session
ORDER BY days_since_last_session;
| Days Since Last Session | Return Rate | Day 7 After Return |
|---|---|---|
| 1-3 days | 35% | 45% |
| 4-7 days | 22% | 30% |
| 8-14 days | 12% | 20% |
| 15-30 days | 6% | 12% |
| 31-60 days | 3% | 8% |
The sooner you re-engage, the better. After 30 days, users are very difficult to bring back.
Measuring Deep Link Quality
Retention as a Quality Signal
Use retention to evaluate which deep links are worth investing in:
SELECT
  route,
  campaign,
  COUNT(DISTINCT user_id) AS users,
  ROUND(COUNT(DISTINCT CASE WHEN return_day = 7 THEN user_id END)::DECIMAL /
    COUNT(DISTINCT user_id) * 100, 1) AS day_7_retention,
  ROUND(AVG(sessions_in_first_week), 1) AS avg_sessions_week_1,
  ROUND(AVG(revenue_30_day), 2) AS avg_revenue_30d
FROM retention_data
WHERE cohort_date >= '2026-06-01'
GROUP BY route, campaign
HAVING COUNT(DISTINCT user_id) >= 50
ORDER BY day_7_retention DESC;
A deep link with high click volume but low Day 7 retention is misleading. It looks successful by top-of-funnel metrics but fails to produce lasting users.
Tolinku for Retention Analytics
Tolinku's analytics track user retention by acquisition source, including deep link type, campaign, and route. View retention curves and cohort comparisons in the Tolinku dashboard.
For cohort analysis, see cohort analysis for deep links: tracking user groups. For analytics fundamentals, see deep link analytics: measuring what matters.
Get deep linking tips in your inbox
One email per week. No spam.