Charts & Funnels
The analytics dashboard includes several chart types to help you understand traffic patterns and conversion rates.
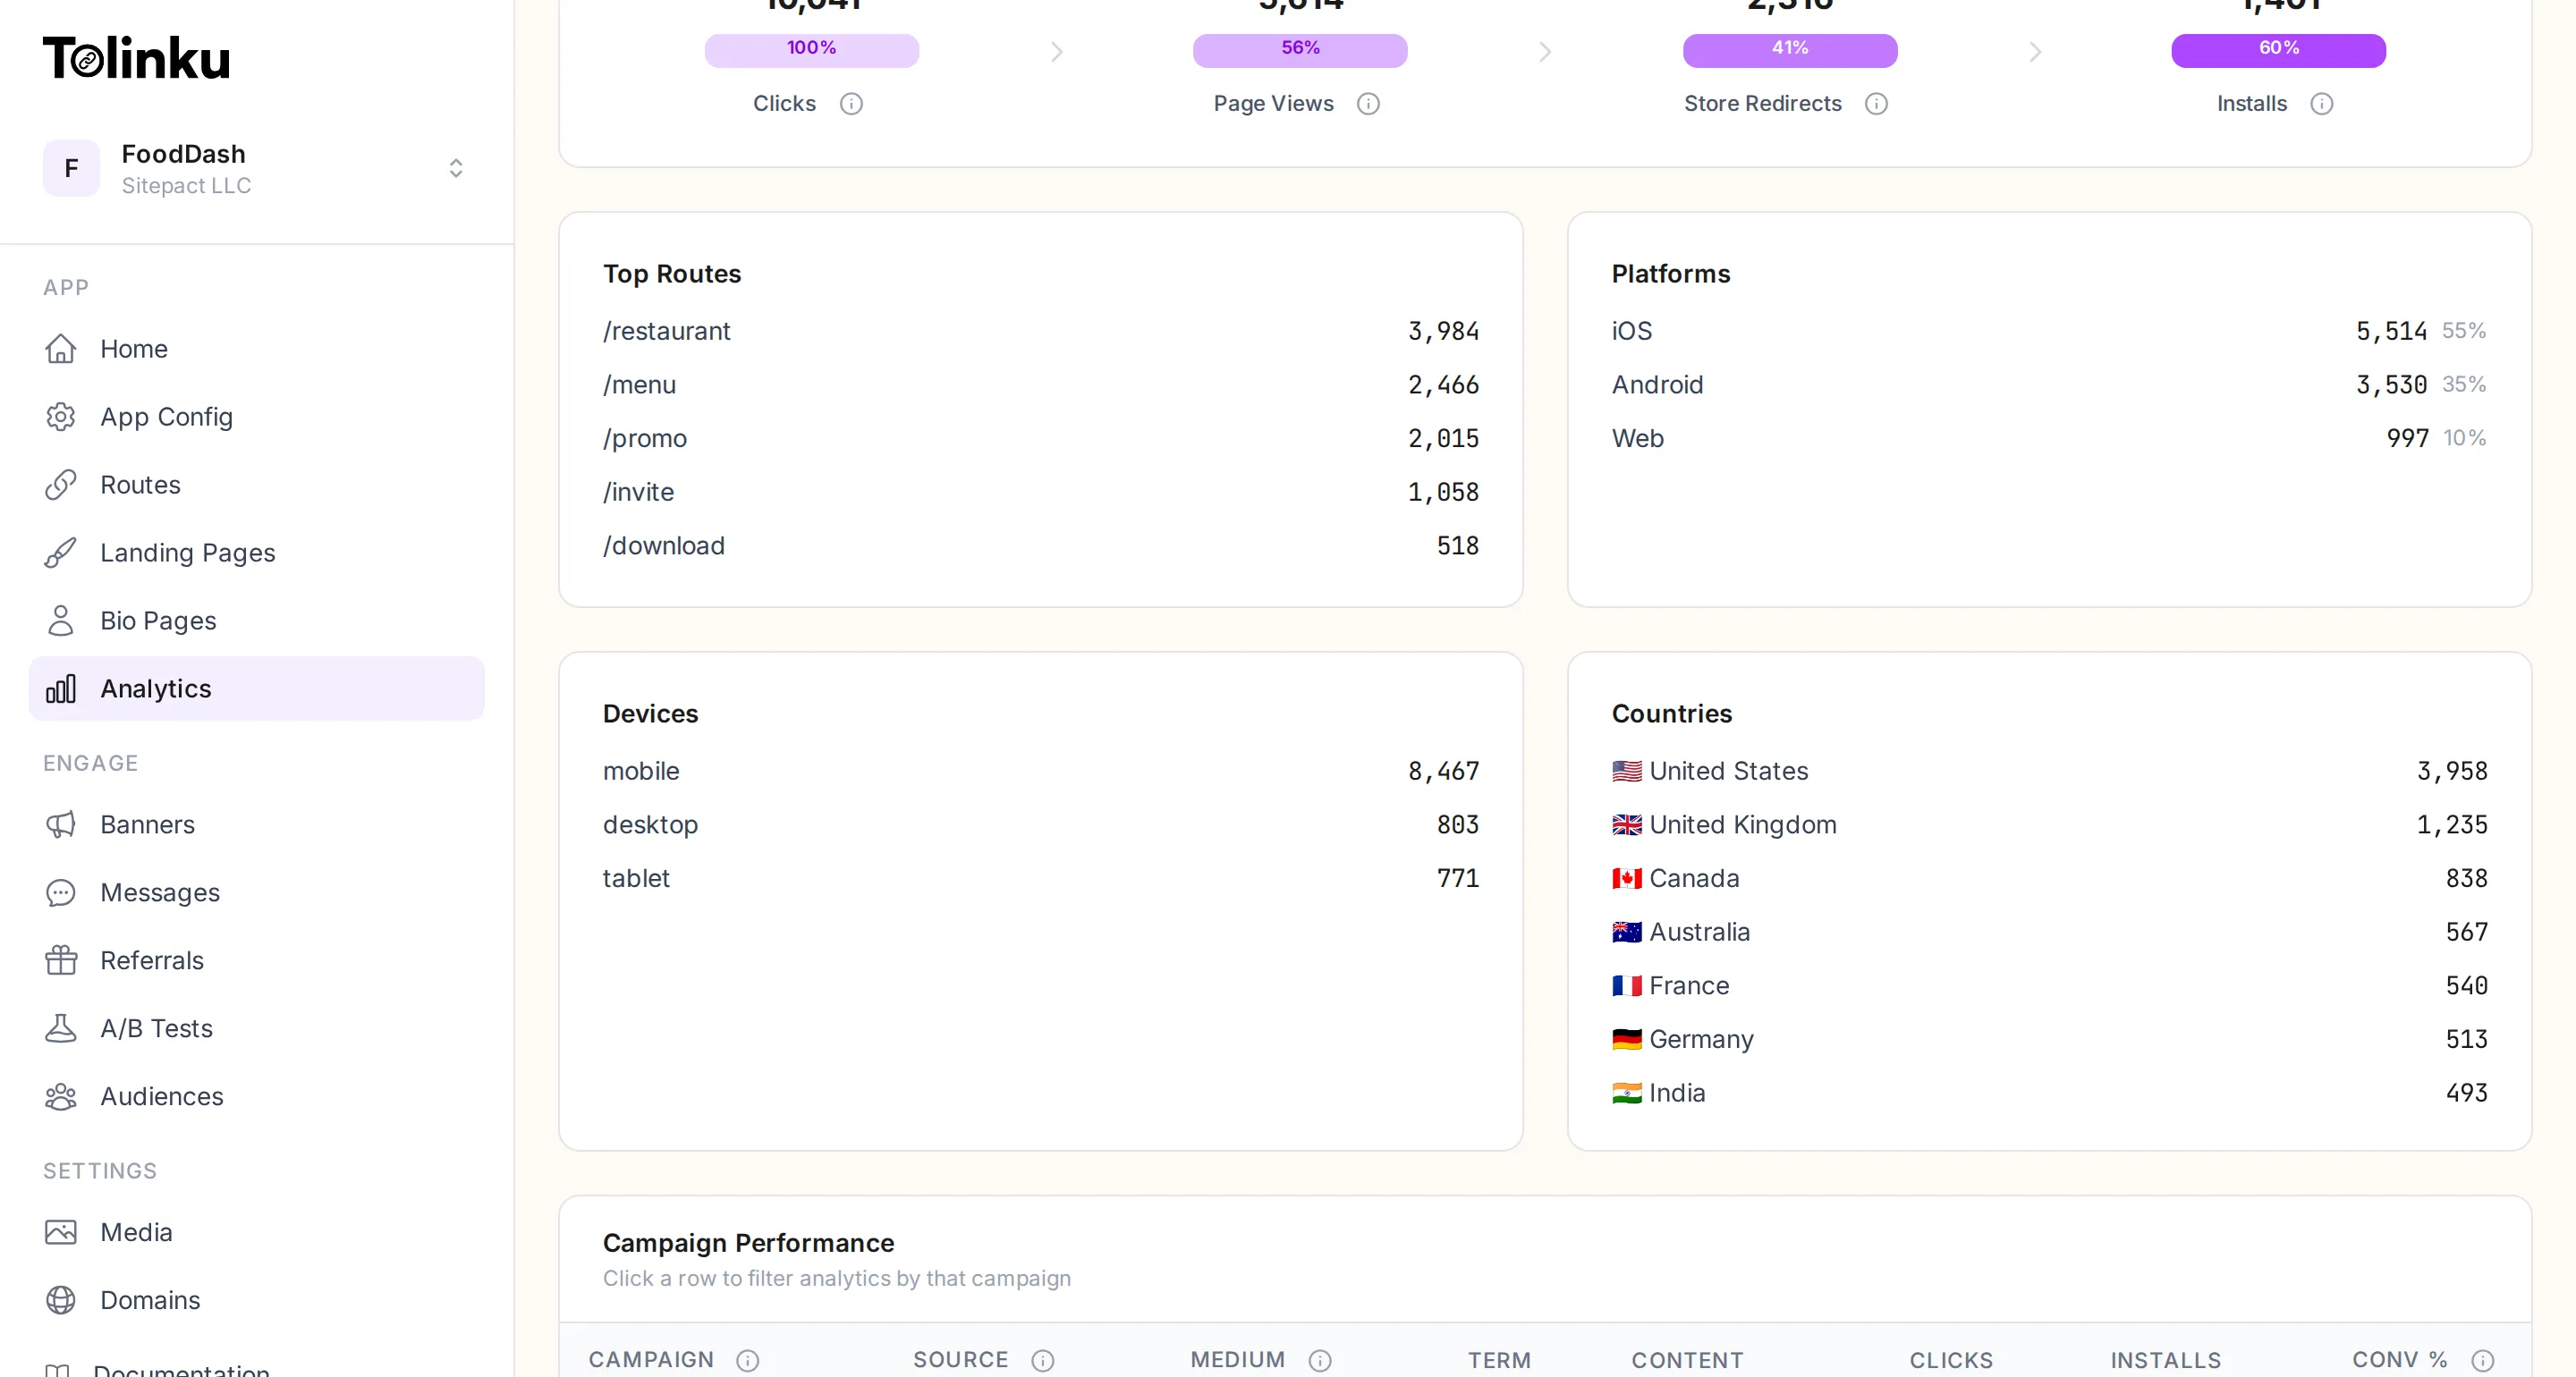
Chart types
Section titled “Chart types”Clicks by date
Section titled “Clicks by date”A time-series line chart showing daily click volume over your selected date range. Use this to spot trends, identify spikes from campaigns, and see how traffic changes over time.
Top routes
Section titled “Top routes”A ranked list of the 20 most-clicked routes with click counts and percentages. This tells you which routes drive the most traffic. Useful for identifying your highest-performing links.
Device breakdown
Section titled “Device breakdown”A list showing the split between mobile, desktop, and tablet visitors with counts and percentages. Deep links are most effective on mobile, so this helps you confirm that your traffic is coming from the right devices.
Country distribution
Section titled “Country distribution”A ranked list of the top 20 countries by click volume with counts and percentages. Useful for understanding where your audience is located and whether you need localized content or region-specific landing pages.
Platform split
Section titled “Platform split”An iOS vs. Android breakdown. This helps you prioritize platform-specific work (e.g. if 80% of your traffic is iOS, focus on Universal Links testing first).
Campaign performance
Section titled “Campaign performance”A table showing clicks and installs per UTM campaign. Compare campaigns side by side to see which ones convert best.
Recent events
Section titled “Recent events”A table of the last 50 individual events with timestamps, event type, country, device, and URL. Useful for debugging or verifying that events are being tracked correctly.
Funnel view
Section titled “Funnel view”The funnel shows conversion rates between stages:
Clicks → Page views → Store redirects → Installs → Link opensEach stage shows the count and the drop-off percentage from the previous stage. For example:
| Stage | Count | Conversion |
|---|---|---|
| Clicks | 10,000 | - |
| Page views | 6,200 | 62% |
| Store redirects | 3,100 | 50% |
| Installs | 1,240 | 40% |
| Link opens | 980 | 79% |
The final “Link opens” stage counts users who open the app via the deep link after installing. Not every click goes through all stages. Users who already have the app installed skip the landing page and store redirect stages entirely. The funnel is most useful for understanding the new-user acquisition path.
Reading the funnel
Section titled “Reading the funnel”- Click to landing view drop-off: If many clicks do not reach the landing page, users might be on desktop (where deep links redirect instead) or your links may be getting bot traffic.
- Landing view to store redirect: A low rate here means users see the landing page but do not tap the install button. Consider improving the landing page design or copy.
- Store redirect to install: This is the App Store/Play Store conversion rate. You cannot control it directly, but a low rate might mean your store listing needs work.
- Install to link open: Measures how many users who installed the app actually opened it via the deep link. A low rate may indicate issues with deferred deep link setup or the app’s onboarding flow.
Ecommerce funnel
Section titled “Ecommerce funnel”On paid plans with ecommerce tracking enabled, a separate ecommerce conversion funnel is available in the Ecommerce tab:
View Item → Add to Cart → View Cart → Begin Checkout → Add Payment Info → PurchaseThis funnel tracks the shopping journey from product discovery to purchase completion. Each stage shows the count and drop-off percentage from the previous step, helping you identify where customers abandon the buying process.
The overview tab also includes a full-journey funnel that combines both funnels: click > install > view item > add to cart > purchase, showing the complete path from deep link click to revenue.