Analytics cost money: platform fees, engineering time to integrate, analyst time to interpret. The investment is worth it when analytics-driven decisions produce more revenue than the analytics cost. This guide shows how to calculate that ROI and communicate it to stakeholders who ask "why are we paying for this?"
This guide covers measuring the ROI of deep link analytics. For deep linking ROI broadly, see measuring deep linking ROI for your mobile app. For connecting deep links to revenue, see revenue attribution: connecting deep links to revenue.
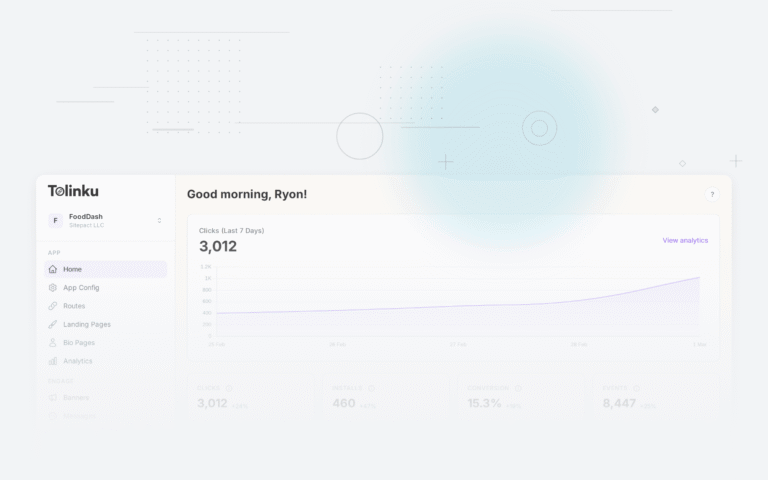
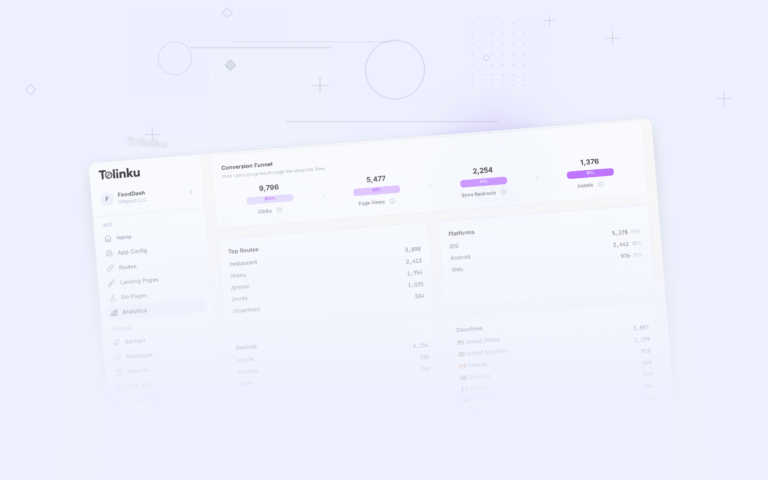
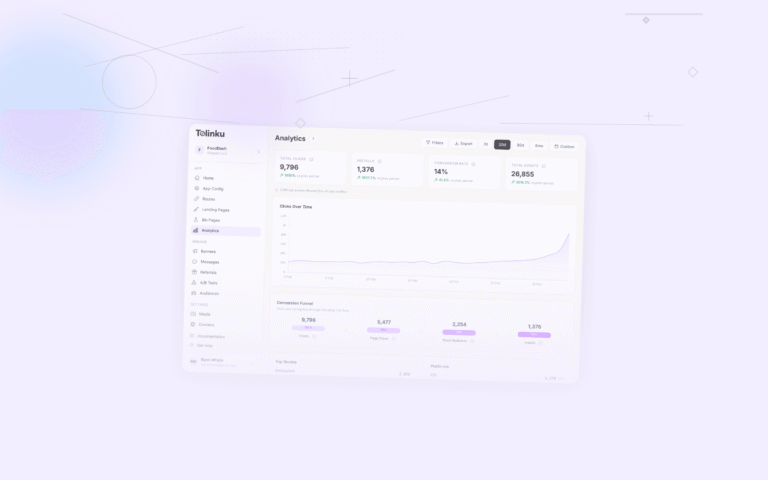
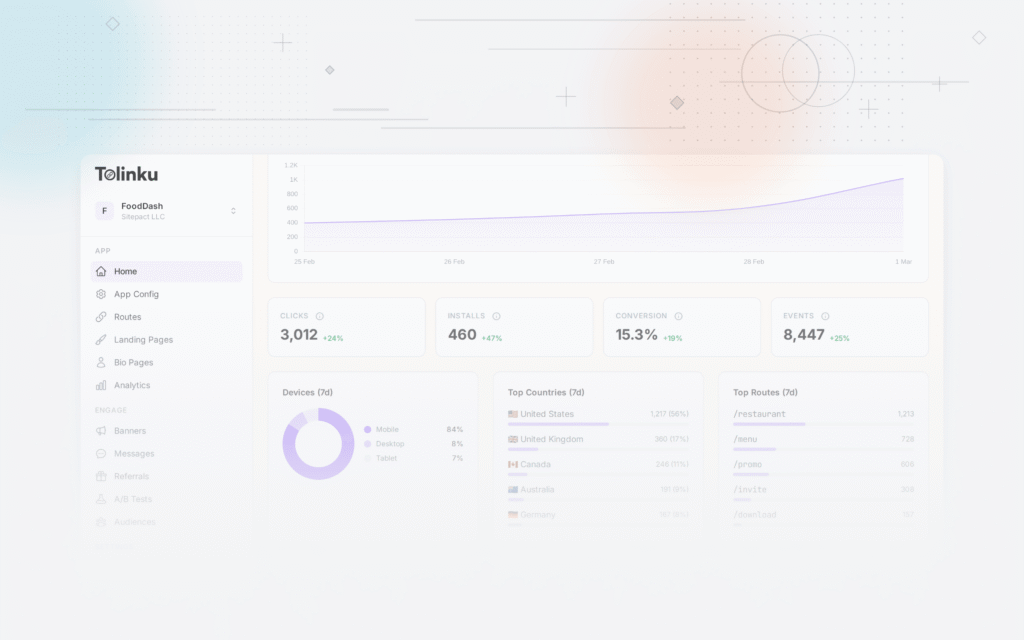
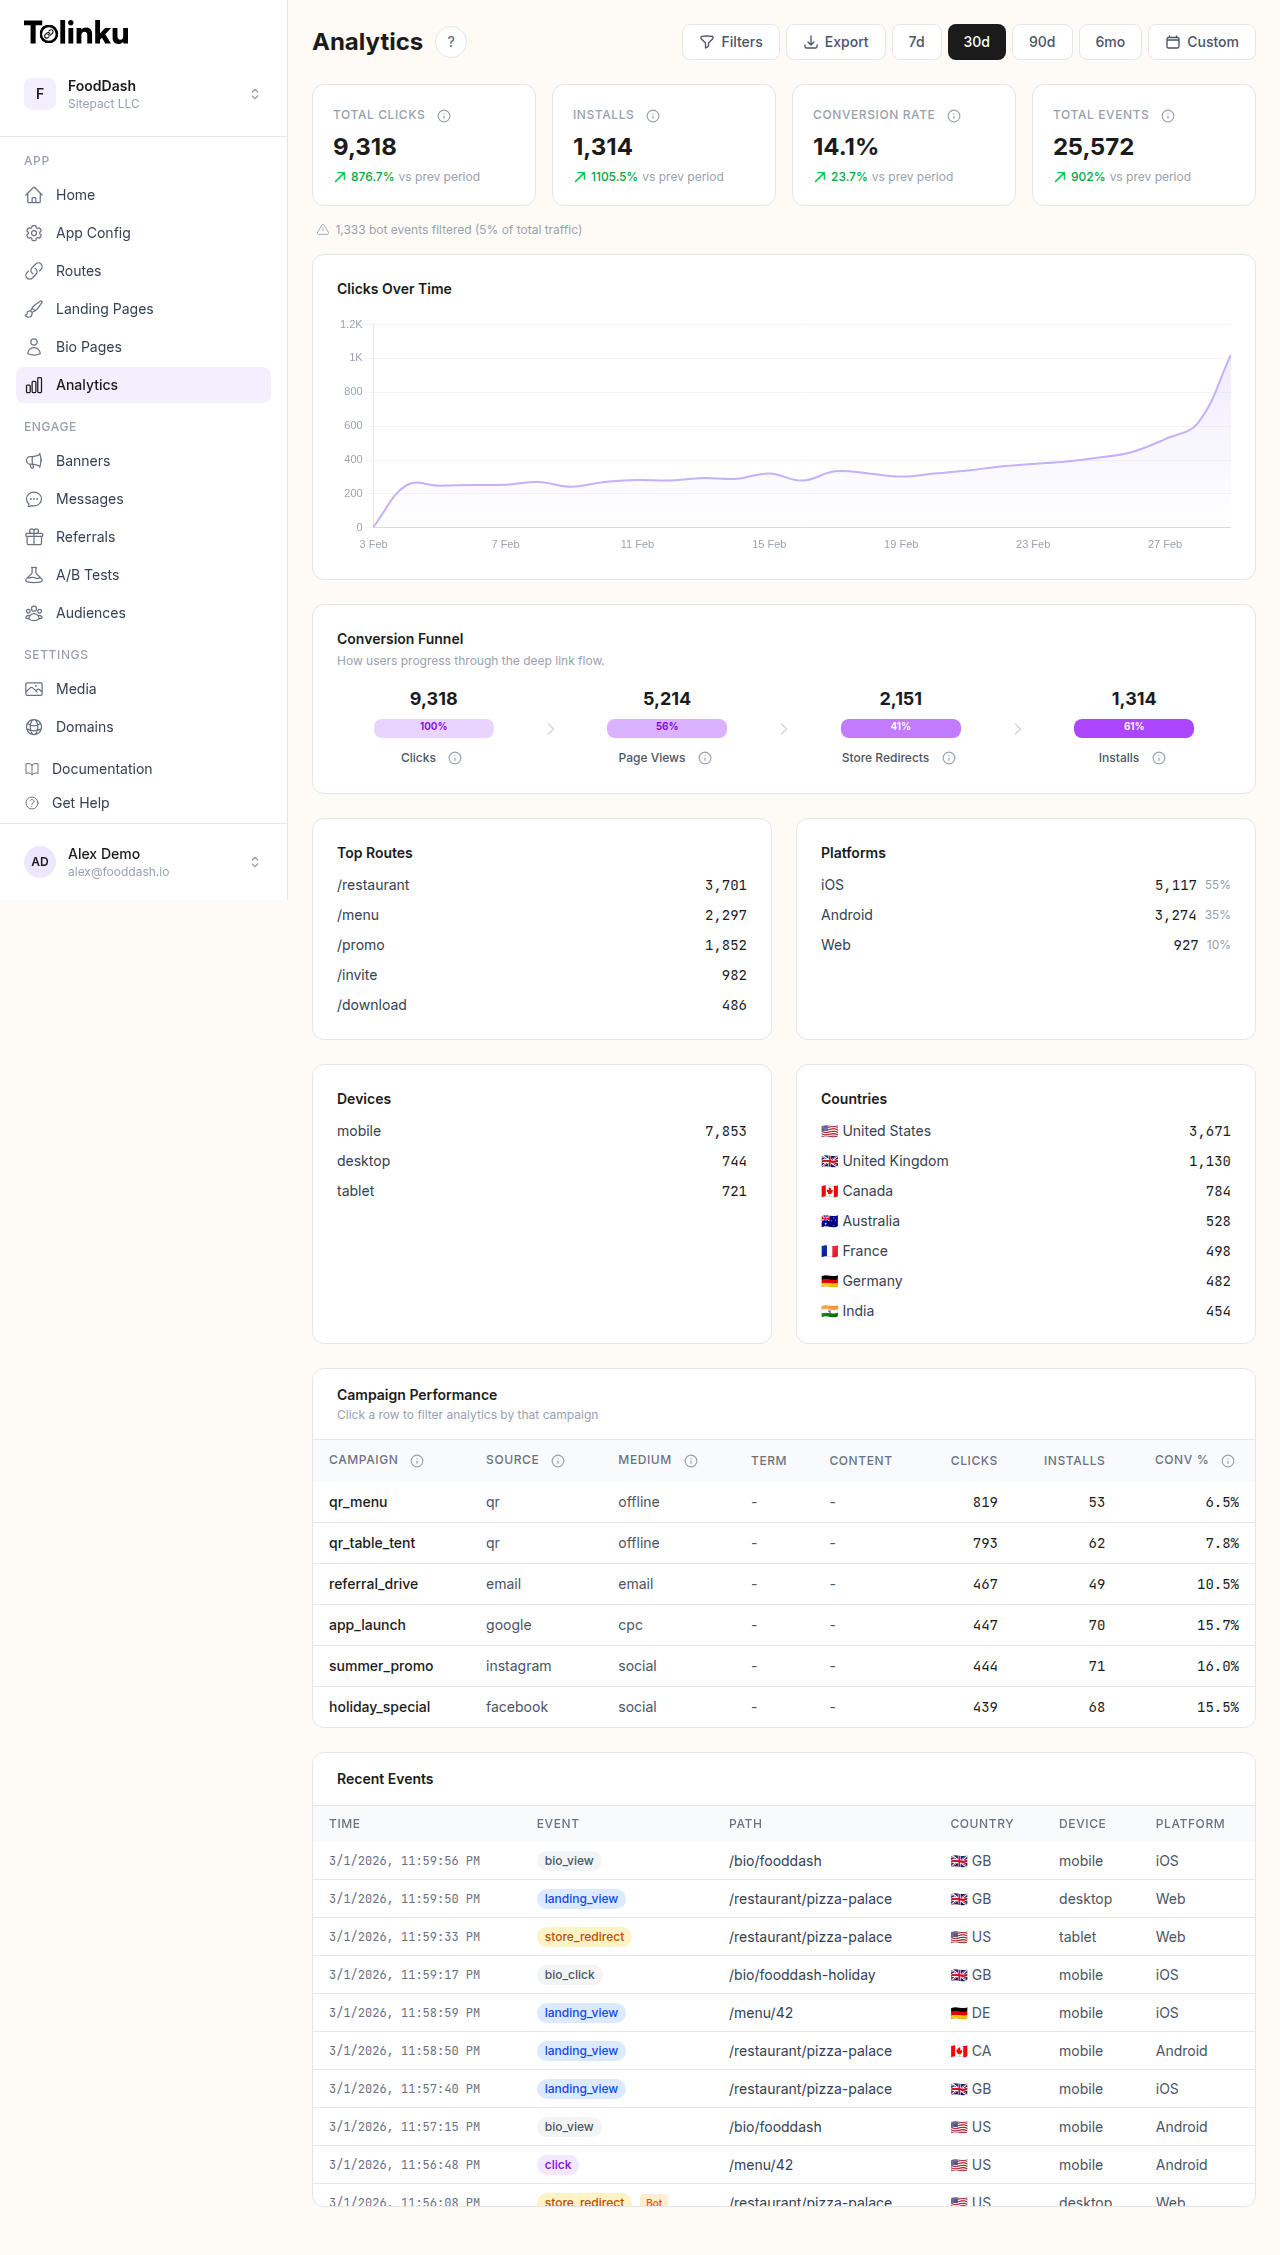 The analytics dashboard with date range selector, filters, charts, and breakdowns.
The ROI Formula
Basic Calculation
Analytics ROI = (Value of analytics-driven improvements - Cost of analytics) / Cost of analytics × 100%
Costs include:
- Analytics platform subscription
- Engineering time for integration and maintenance
- Analyst/marketer time spent on analysis and reporting
- Data warehouse costs (storage, compute)
Value includes:
- Revenue gained from campaign optimization
- Cost saved from stopping underperforming campaigns
- Revenue gained from fixing broken deep links faster
- Value of improved user retention from data-driven re-engagement
Example Calculation
| Item | Monthly Cost/Value |
|---|---|
| Costs | |
| Analytics platform | $200 |
| Engineering maintenance (4 hrs/mo × $75/hr) | $300 |
| Analyst time (20 hrs/mo × $50/hr) | $1,000 |
| Data warehouse (storage + queries) | $100 |
| Total cost | $1,600 |
| Value | |
| Budget reallocation (shifted $3K from paid social to email, gained $2,100 extra revenue) | $2,100 |
| Broken link detection (caught AASA issue in 15 min vs 4 hrs, saved ~2,000 failed deep links) | $800 |
| Campaign optimization (A/B tested 3 campaigns, improved conversion 18%) | $3,200 |
| Retention improvement (data-driven re-engagement increased Day 30 retention 12%) | $1,500 |
| Total value | $7,600 |
| ROI | 375% |
Quantifying Analytics Value
Budget Reallocation
The most direct value of analytics: move money from low-performing channels to high-performing ones.
-- Before analytics: equal budget split
-- Channel A: $5,000 spend, $7,500 revenue (150% ROAS)
-- Channel B: $5,000 spend, $15,000 revenue (300% ROAS)
-- Total: $10,000 spend, $22,500 revenue

-- After analytics: data-driven allocation
-- Channel A: $3,000 spend, $4,500 revenue (150% ROAS)
-- Channel B: $7,000 spend, $21,000 revenue (300% ROAS)
-- Total: $10,000 spend, $25,500 revenue

-- Value of analytics = $25,500 - $22,500 = $3,000/month
This is conservative. In practice, reducing spend on a low-ROAS channel often produces better returns than linear scaling suggests, because you cut the least efficient portion of spend first.
Faster Incident Detection
Without analytics alerting, a broken deep link might go unnoticed for hours. With alerting, you detect it in minutes.
| Scenario | Without Analytics | With Analytics |
|---|---|---|
| Time to detect broken AASA | 4 hours | 15 minutes |
| Deep link clicks during outage | ~2,000 | ~125 |
| Fallback rate during outage | 90% | 90% |
| Users sent to fallback instead of app | ~1,800 | ~112 |
| Estimated lost conversions (15% rate) | 270 | 17 |
| Revenue per conversion ($20 avg) | $5,400 lost | $340 lost |
| Value of faster detection | $5,060 saved |
If this happens once per quarter, faster detection saves ~$20,000/year.
Campaign Optimization
A/B testing deep link landing screens, CTAs, and timing requires analytics. Without data, you guess.
Campaign: Summer Sale
─────────────────────────────
Before optimization (guessing):
  CTR: 3.5%
  Conversion rate: 8%
  Revenue per 10,000 emails: $560

After 3 rounds of A/B testing (data-driven):
  CTR: 5.2%  (+49%)
  Conversion rate: 11.5%  (+44%)
  Revenue per 10,000 emails: $1,196

Value per 10,000 emails: $636
Monthly email volume: 100,000
Monthly value: $6,360
Retention Improvement
Analytics reveal which deep link types produce the best retention, allowing you to double down:
| Metric | Before Analytics | After Analytics | Improvement |
|---|---|---|---|
| Day 7 retention (deep-linked users) | 18% | 24% | +33% |
| Monthly active users retained | 5,400 | 7,200 | +1,800 |
| LTV per retained user | $12 | $12 | – |
| Monthly value of retained users | $64,800 | $86,400 | +$21,600 |
Communicating ROI to Stakeholders
For Executives
Executives want a single number and a trend:
ANALYTICS ROI SUMMARY - Q2 2026
─────────────────────────────────────
Investment:           $4,800/quarter
Revenue impact:       $22,800/quarter
ROI:                  375%
Trend:                ↑ from 290% in Q1

Key insight: Shifting $6K from paid social to email
campaigns (based on ROAS data) generated $8,400 in
additional revenue.
For Finance Teams
Finance wants detailed cost breakdown and conservative estimates:
| Line Item | Q1 | Q2 | Q2 vs Q1 |
|---|---|---|---|
| Platform cost | $600 | $600 | 0% |
| Engineering time | $900 | $750 | -17% |
| Analyst time | $3,000 | $3,000 | 0% |
| Infrastructure | $300 | $300 | 0% |
| Total cost | $4,800 | $4,650 | -3% |
| Budget reallocation value | $6,300 | $8,400 | +33% |
| Incident prevention | $5,060 | $5,060 | 0% |
| Campaign optimization | $4,500 | $6,360 | +41% |
| Retention improvement | $3,000 | $3,600 | +20% |
| Total value | $18,860 | $23,420 | +24% |
| Net value | $14,060 | $18,770 | +33% |
| ROI | 293% | 404% |
For Marketing Managers
Marketing managers want to see how analytics directly improved their campaigns:
- "Analytics told us to shift budget from Instagram to email." Result: $8,400 more revenue at the same spend.
- "A/B test data showed that personalized CTAs convert 40% better." Result: 1,200 more conversions per month.
- "Geographic data revealed our German campaigns had an Android App Links issue." Result: Fixed the issue, 65% open rate recovered to 78%.
Building the Business Case
Before You Have Analytics
If you are trying to justify the initial analytics investment:
- Estimate current blind spots. How many deep link clicks do you send per month? What is your conversion rate? How often do issues go undetected?
- Estimate improvement potential. Industry data suggests that data-driven optimization improves campaign performance by 15-30% (Harvard Business Review).
- Calculate expected value. If your deep links drive $50,000/month in revenue and analytics improves that by 15%, the value is $7,500/month.
- Compare to cost. If analytics costs $1,600/month, the expected ROI is 369%.
After You Have Analytics
Track the actual value delivered:
interface AnalyticsROITracker {
  period: string;
  costs: {
    platform: number;
    engineering: number;
    analyst: number;
    infrastructure: number;
  };
  value: {
    budgetReallocation: {
      description: string;
      amount: number;
    }[];
    incidentPrevention: {
      description: string;
      amount: number;
    }[];
    campaignOptimization: {
      description: string;
      amount: number;
    }[];
    retentionImprovement: {
      description: string;
      amount: number;
    }[];
  };
}

function calculateROI(tracker: AnalyticsROITracker): number {
  const totalCost = Object.values(tracker.costs).reduce((a, b) => a + b, 0);
  const totalValue = [
    ...tracker.value.budgetReallocation,
    ...tracker.value.incidentPrevention,
    ...tracker.value.campaignOptimization,
    ...tracker.value.retentionImprovement
  ].reduce((sum, item) => sum + item.amount, 0);

  return ((totalValue - totalCost) / totalCost) * 100;
}
Common Objections
"We can not measure the value precisely"
True. Some analytics value is hard to quantify (better team alignment, faster decision-making, reduced guesswork). Focus on the measurable improvements (budget reallocation, incident detection time) and note the intangible benefits separately.
"Our team does not have time to analyze data"
This is a workflow problem, not an analytics problem. Start with automated alerts (no analysis needed) and pre-built dashboards (no query writing needed). Add custom analysis as the team matures.
"Free tools are good enough"
Free tools provide basic click counts. They do not provide: campaign attribution, funnel analysis, A/B test measurement, retention cohorts, or real-time alerting. The value gap between basic counts and actionable insights is where ROI lives.
"We already have a BI tool"
A BI tool visualizes data. It does not collect deep link analytics. You need both: a deep link analytics platform to collect and process the data, and optionally a BI tool to create custom visualizations.
Tolinku for Analytics ROI
Tolinku's analytics provide campaign-level performance data, real-time monitoring, and data export capabilities. The Tolinku dashboard gives teams immediate visibility into deep link performance without custom engineering work.
For deep linking ROI, see measuring deep linking ROI for your mobile app. For analytics fundamentals, see deep link analytics: measuring what matters.
Get deep linking tips in your inbox
One email per week. No spam.