Marketing teams use deep link analytics to measure campaigns. Product teams should use the same data to make product decisions: which features are users actually reaching? Where do onboarding flows break? Which entry points produce the most engaged users?
This guide covers how product teams can use deep link analytics. For marketing-focused analytics, see deep link analytics for marketing teams. For the full analytics overview, see deep link analytics: measuring what matters.
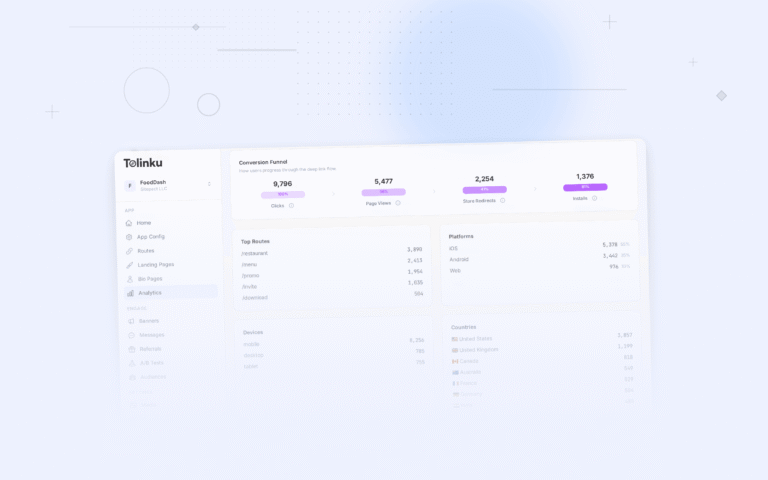
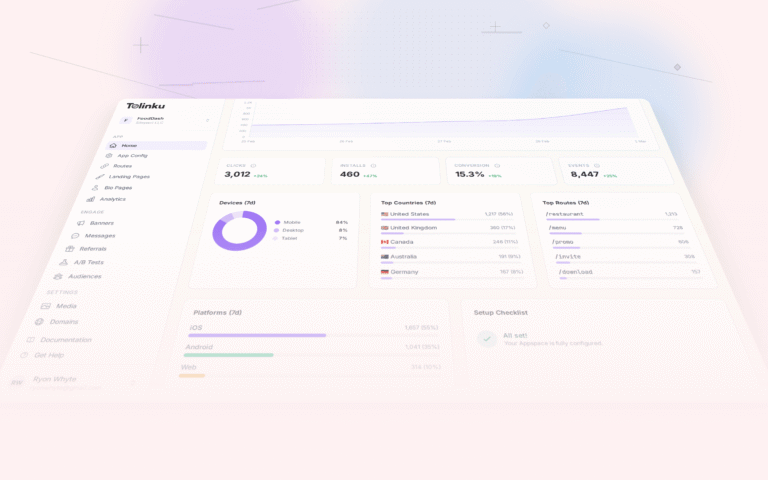
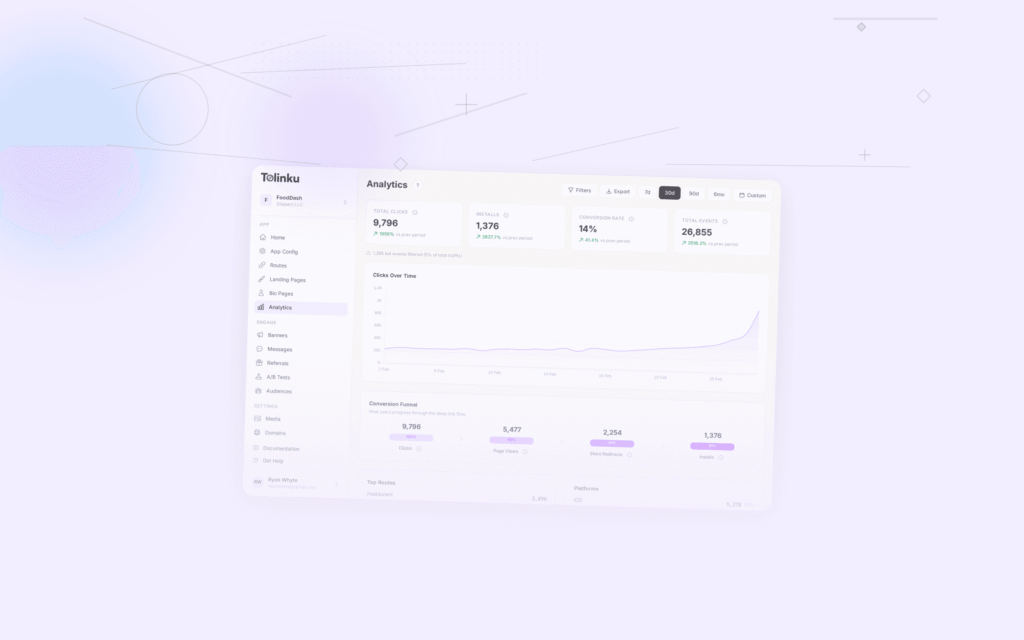
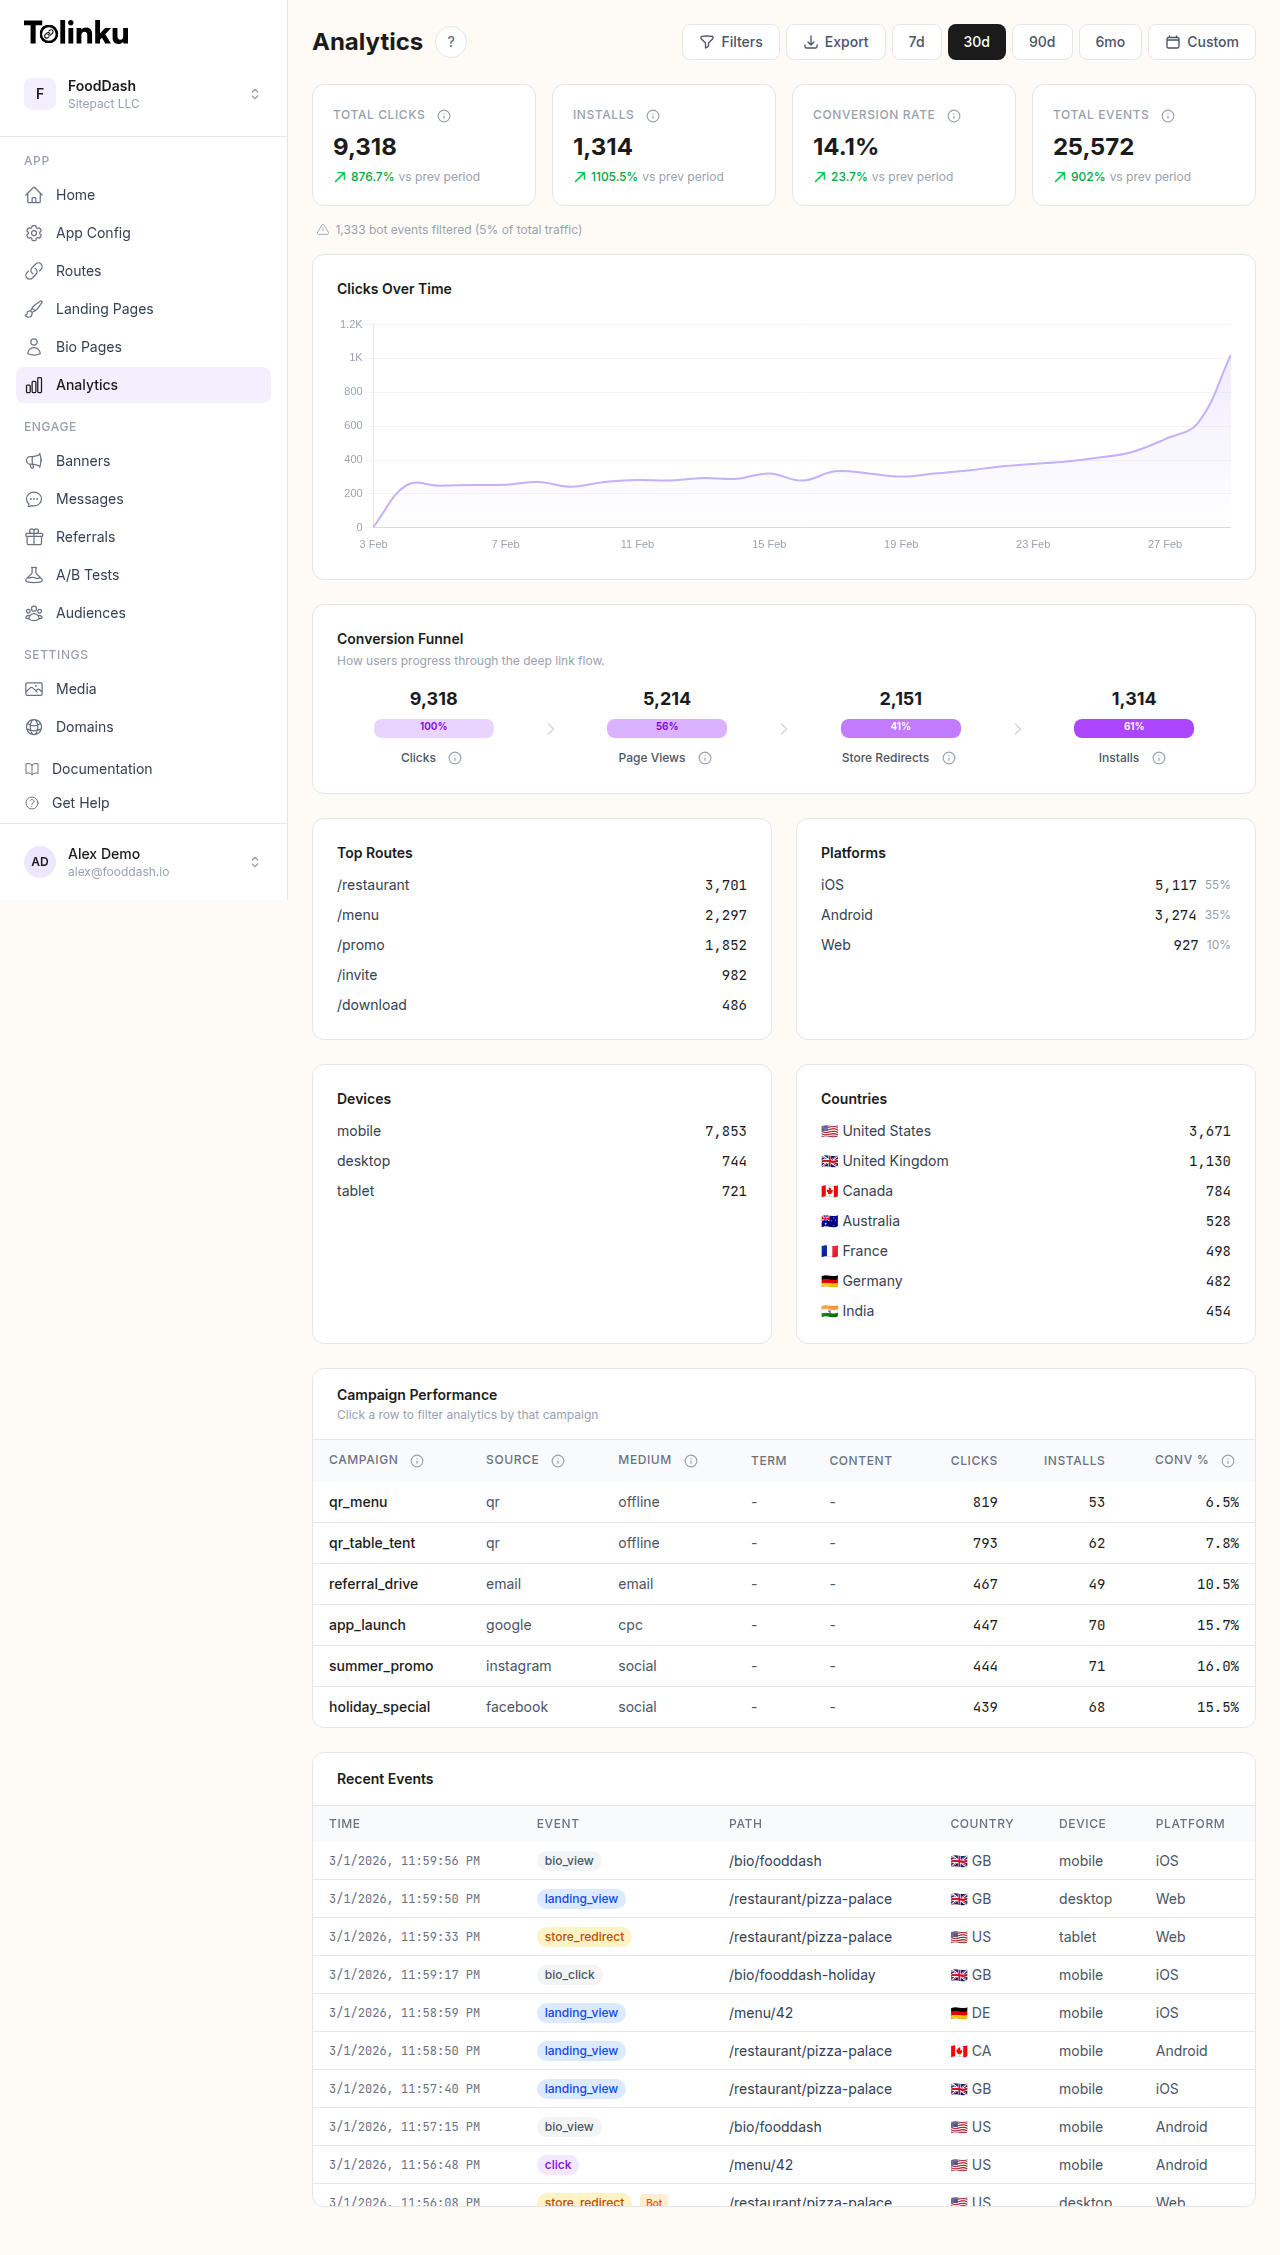 The analytics dashboard with date range selector, filters, charts, and breakdowns.
Product Questions Deep Link Data Answers
Feature Discovery
Deep links are controlled entry points. When you deep link a user to a feature, you know exactly which feature they arrived at and what happened next.
| Product Question | Deep Link Data Point |
|---|---|
| Are users finding Feature X? | How many deep links to Feature X are clicked vs ignored? |
| Which features drive retention? | Day 7 retention by landing route |
| Does onboarding improve engagement? | Session depth: onboarding deep link vs generic home screen |
| Which entry point produces power users? | Feature adoption rate by first deep link route |
| Where do users get stuck? | Fallback rate and error rate by route |
Feature Adoption Tracking
When you launch a new feature and deep link users to it, you can measure adoption:
SELECT
  route,
  COUNT(DISTINCT click_id) AS deep_link_clicks,
  COUNT(DISTINCT CASE WHEN outcome = 'app_opened' THEN user_id END) AS users_reached,
  COUNT(DISTINCT CASE WHEN feature_used THEN user_id END) AS users_adopted,
  ROUND(
    COUNT(DISTINCT CASE WHEN feature_used THEN user_id END)::DECIMAL /
    NULLIF(COUNT(DISTINCT CASE WHEN outcome = 'app_opened' THEN user_id END), 0) * 100, 1
  ) AS adoption_rate
FROM deep_link_clicks dlc
LEFT JOIN feature_events fe
  ON dlc.user_id = fe.user_id
  AND fe.feature = 'new_search'
  AND fe.timestamp BETWEEN dlc.timestamp AND dlc.timestamp + INTERVAL '7 days'
WHERE dlc.route = '/features/new-search'
  AND dlc.timestamp >= '2026-07-01'
GROUP BY route;
This tells you: of users who clicked the deep link to the new search feature, what percentage actually used it within 7 days?
Onboarding Flow Analysis
Measuring Onboarding Deep Links
Deep links during onboarding (email verification, profile setup, feature tours) should be measured as a funnel:
SELECT
  step,
  COUNT(DISTINCT user_id) AS users,
  ROUND(
    COUNT(DISTINCT user_id)::DECIMAL /
    FIRST_VALUE(COUNT(DISTINCT user_id)) OVER (ORDER BY step_order) * 100, 1
  ) AS pct_of_start
FROM onboarding_funnel
WHERE cohort_date >= '2026-07-01'
  AND acquisition_source = 'deep_link'
GROUP BY step, step_order
ORDER BY step_order;
| Step | Users | % of Start |
|---|---|---|
| Deep link click | 5,000 | 100% |
| App opened | 3,750 | 75% |
| Onboarding screen 1 | 3,200 | 64% |
| Onboarding screen 2 | 2,400 | 48% |
| Onboarding complete | 1,800 | 36% |
| First key action | 1,200 | 24% |
If 25% of users drop between "App opened" and "Onboarding screen 1," the transition from deep link landing to onboarding is broken. Maybe the deep link lands on the wrong screen, or there is a loading delay.
Comparing Onboarding Paths
Different deep link entry points may produce different onboarding completion rates:
| Entry Point | Onboarding Completion | First Key Action | Day 7 Retention |
|---|---|---|---|
/welcome (generic) |
36% | 24% | 18% |
/products/:id (product) |
42% | 31% | 25% |
/invite/:code (referral) |
55% | 40% | 35% |
/features/search (feature) |
38% | 28% | 22% |
Referral deep links produce the best onboarding and retention because the user has social context. Product deep links also perform well because the user has immediate value to explore.
Drop-Off Analysis
Identifying Drop-Off Points
When a deep link takes a user to a specific screen, product teams want to know what happens next:
SELECT
  landing_route,
  next_action,
  COUNT(*) AS occurrences,
  ROUND(COUNT(*)::DECIMAL / SUM(COUNT(*)) OVER (PARTITION BY landing_route) * 100, 1) AS pct
FROM (
  SELECT
    dlc.route AS landing_route,
    COALESCE(
      FIRST_VALUE(ue.action) OVER (
        PARTITION BY dlc.click_id ORDER BY ue.timestamp
      ),
      'no_action'
    ) AS next_action
  FROM deep_link_clicks dlc
  LEFT JOIN user_events ue
    ON dlc.user_id = ue.user_id
    AND ue.timestamp BETWEEN dlc.timestamp AND dlc.timestamp + INTERVAL '5 minutes'
  WHERE dlc.outcome = 'app_opened'
) sub
GROUP BY landing_route, next_action
ORDER BY landing_route, occurrences DESC;
| Landing Route | Next Action | % |
|---|---|---|
/products/:id |
view_details | 45% |
/products/:id |
add_to_cart | 22% |
/products/:id |
back_navigation | 18% |
/products/:id |
no_action | 15% |
15% of users who land on a product page via deep link take no action. This could indicate slow loading, confusing UI, or mismatched expectations between the link and the content.
Platform-Specific Drop-Offs
The same deep link may fail differently on iOS vs Android:
SELECT
  platform,
  route,
  COUNT(*) AS clicks,
  ROUND(SUM(CASE WHEN outcome = 'app_opened' THEN 1 ELSE 0 END)::DECIMAL / COUNT(*) * 100, 1) AS open_rate,
  ROUND(SUM(CASE WHEN outcome = 'fallback' THEN 1 ELSE 0 END)::DECIMAL / COUNT(*) * 100, 1) AS fallback_rate,
  ROUND(SUM(CASE WHEN outcome = 'error' THEN 1 ELSE 0 END)::DECIMAL / COUNT(*) * 100, 1) AS error_rate
FROM deep_link_clicks
WHERE timestamp >= '2026-07-01'
GROUP BY platform, route
HAVING COUNT(*) >= 100
ORDER BY error_rate DESC;
If a route has a 5% error rate on Android but 0% on iOS, there is likely an Intent filter or App Link configuration issue.
Measuring User Quality by Entry Point
Session Depth
How deeply do users engage after arriving via different deep links?
SELECT
  dlc.route AS entry_route,
  COUNT(DISTINCT dlc.user_id) AS users,
  ROUND(AVG(s.screens_viewed), 1) AS avg_screens,
  ROUND(AVG(s.session_duration_seconds), 0) AS avg_duration_sec,
  ROUND(AVG(s.actions_taken), 1) AS avg_actions
FROM deep_link_clicks dlc
JOIN sessions s
  ON dlc.user_id = s.user_id
  AND s.session_start BETWEEN dlc.timestamp AND dlc.timestamp + INTERVAL '1 hour'
WHERE dlc.outcome = 'app_opened'
  AND dlc.timestamp >= '2026-07-01'
GROUP BY dlc.route
HAVING COUNT(DISTINCT dlc.user_id) >= 50
ORDER BY avg_actions DESC;
| Entry Route | Users | Avg Screens | Avg Duration | Avg Actions |
|---|---|---|---|---|
/social/feed |
1,200 | 8.3 | 420s | 12.5 |
/products/:id |
2,500 | 5.1 | 180s | 6.2 |
/offers/weekly |
800 | 4.8 | 150s | 5.0 |
/settings |
400 | 2.1 | 45s | 1.8 |
/dashboard |
600 | 3.5 | 90s | 3.2 |
Social feed deep links produce the longest, most engaged sessions. Settings deep links produce short, utilitarian sessions (which is expected and not a problem).
Revenue per Entry Point
For apps with in-app purchases or transactions:
SELECT
  dlc.route AS entry_route,
  dlc.source,
  COUNT(DISTINCT dlc.user_id) AS users,
  ROUND(SUM(COALESCE(t.amount, 0)) / COUNT(DISTINCT dlc.user_id), 2) AS revenue_per_user,
  ROUND(SUM(COALESCE(t.amount, 0)), 2) AS total_revenue
FROM deep_link_clicks dlc
LEFT JOIN transactions t
  ON dlc.user_id = t.user_id
  AND t.timestamp BETWEEN dlc.timestamp AND dlc.timestamp + INTERVAL '30 days'
WHERE dlc.outcome = 'app_opened'
GROUP BY dlc.route, dlc.source
HAVING COUNT(DISTINCT dlc.user_id) >= 50
ORDER BY revenue_per_user DESC;
Product Team Dashboard
Key Metrics to Track
A product team deep link dashboard should include:
- Route health: Open rate, error rate, and latency for each deep link route.
- Feature adoption funnel: Deep link click to feature use, by route.
- Session quality: Screens viewed, session duration, and actions taken by entry point.
- Onboarding completion: Funnel from deep link to onboarding complete, segmented by source.
- Retention by entry point: Day 1/7/30 retention broken down by first deep link route.
Alerting for Product Teams
Set alerts for product-relevant issues:
| Alert | Threshold | Action |
|---|---|---|
| Route error rate > 2% | Check every 15 minutes | Investigate broken deep link |
| Open rate drops > 10% for a route | Check hourly | AASA/assetlinks.json may be misconfigured |
| Onboarding completion < 30% | Check daily | Review onboarding flow for new deep link users |
| Feature adoption < 10% (deep-linked) | Check weekly | Feature may not match user expectations from the link |
Tolinku for Product Analytics
Tolinku's analytics provide route-level performance data, including open rates, fallback rates, and error rates. Product teams can use the Tolinku dashboard to monitor deep link health and identify routes that need attention.
For marketing analytics, see deep link analytics for marketing teams. For growth metrics, see app growth metrics: the 15 KPIs that matter.
Get deep linking tips in your inbox
One email per week. No spam.