A smart banner you ship on day one is almost never the best version. It is a hypothesis: a guess that this particular combination of copy, color, timing, and placement will convince mobile visitors to install your app. A/B testing turns that guess into a measured, improving system.
Most growth teams underinvest in banner testing. They run their email campaigns through rigorous split tests but treat the banner as a set-and-forget widget. This guide covers how to run disciplined banner experiments that produce reliable conclusions.
What to Test (and What Not to)
The most important rule in A/B testing is to test one variable at a time. If you change the CTA copy, button color, and timing simultaneously, you cannot tell which change drove the result.
Prioritize your tests by expected impact and ease of implementation:
High-impact, easy to test:
- CTA button copy
- Banner headline / subtitle
- Button color (within your brand palette)
- Timing (2-second delay vs. 5-second delay vs. scroll-triggered)
High-impact, slightly more complex:
- Banner placement (top vs. bottom)
- With or without app store rating in the subtitle
- Personalized copy vs. generic copy
Lower-impact (test later):
- Icon size
- Font weight
- Border radius of the CTA button
Do not test your brand color against an entirely different color. That introduces too many confounds and risks damaging brand consistency for marginal gain.
Formulating a Hypothesis
Every test needs a hypothesis before you run it. Not "let's see which is better," but a specific prediction with a reason behind it.
Format: "Changing [X] to [Y] will increase [metric] because [reason]."
Example: "Changing the CTA copy from 'Get the App' to 'Track your order in the app' will increase click-through rate because it tells the user what they can do immediately rather than making a generic request."
Writing the hypothesis forces you to think about why a change might work, which makes the result easier to interpret. When the test ends, you learn whether your reasoning was right, not just whether the number went up or down.
Choosing the Right Metric
Click-through rate (CTR) measures how many users who see the banner tap the CTA. It is easy to track and responds quickly to changes. However, CTR alone can be misleading.
A banner with aggressive copy might have a high CTR but send low-quality clicks: users who tap out of curiosity, realize the app is not what they expected, and never install. A banner with more measured copy might have a lower CTR but send users who actually complete the install.
The best primary metric depends on where you are in the optimization process:
- Early stage: Use CTR. You need to understand what makes users engage with the banner at all.
- Later stage: Use install rate or the install-to-session conversion. This tells you whether banner clicks are resulting in durable app adoption.
The Tolinku analytics dashboard tracks both CTR and downstream install events, so you can set whichever matters most as your primary metric for each test.
Sample Size and Statistical Significance
The most common mistake in A/B testing is stopping too early. A test that has run for two days with 200 impressions per variant has very wide confidence intervals. The result is nearly meaningless.
To determine how long to run your test, you need:
- Your current baseline CTR (what percentage of visitors tap the banner now)
- The minimum effect size you care about detecting (e.g., a 10% relative lift)
- Your desired statistical significance level (typically 95%, meaning a 5% false positive rate)
- Your desired statistical power (typically 80%, meaning you will detect a real effect 80% of the time)
Evan Miller's sample size calculator is a reliable free tool for this calculation.
Example: if your baseline CTR is 5% and you want to detect a 10% relative lift (to 5.5%), you need roughly 31,000 impressions per variant at 95% significance and 80% power. That might be one week of traffic on a high-volume page or three weeks on a lower-traffic page.
Do not stop the test early just because one variant looks better. Peeking at results while a test runs and stopping when you see significance inflates your false positive rate substantially.
Segmenting Your Tests
A banner test run across all mobile visitors pools together iOS and Android users, new visitors and returning users, users from paid campaigns and organic search. These groups may respond very differently.
Consider segmenting your tests by:
- Operating system: iOS users may respond better to copy that mentions "App Store" explicitly. Android users may respond better to different framing.
- Traffic source: Users arriving from a paid ad already have purchase intent. Users arriving from organic search may need more convincing. The optimal banner copy differs.
- New vs. returning: A returning user who has visited five times without installing has already resisted the generic "Get the App" pitch. They may need a stronger hook or a more specific value proposition.
Tolinku's targeting rules let you define audience segments for each banner variant, so you can run tests that are scoped to a specific user group rather than pooling everyone together.
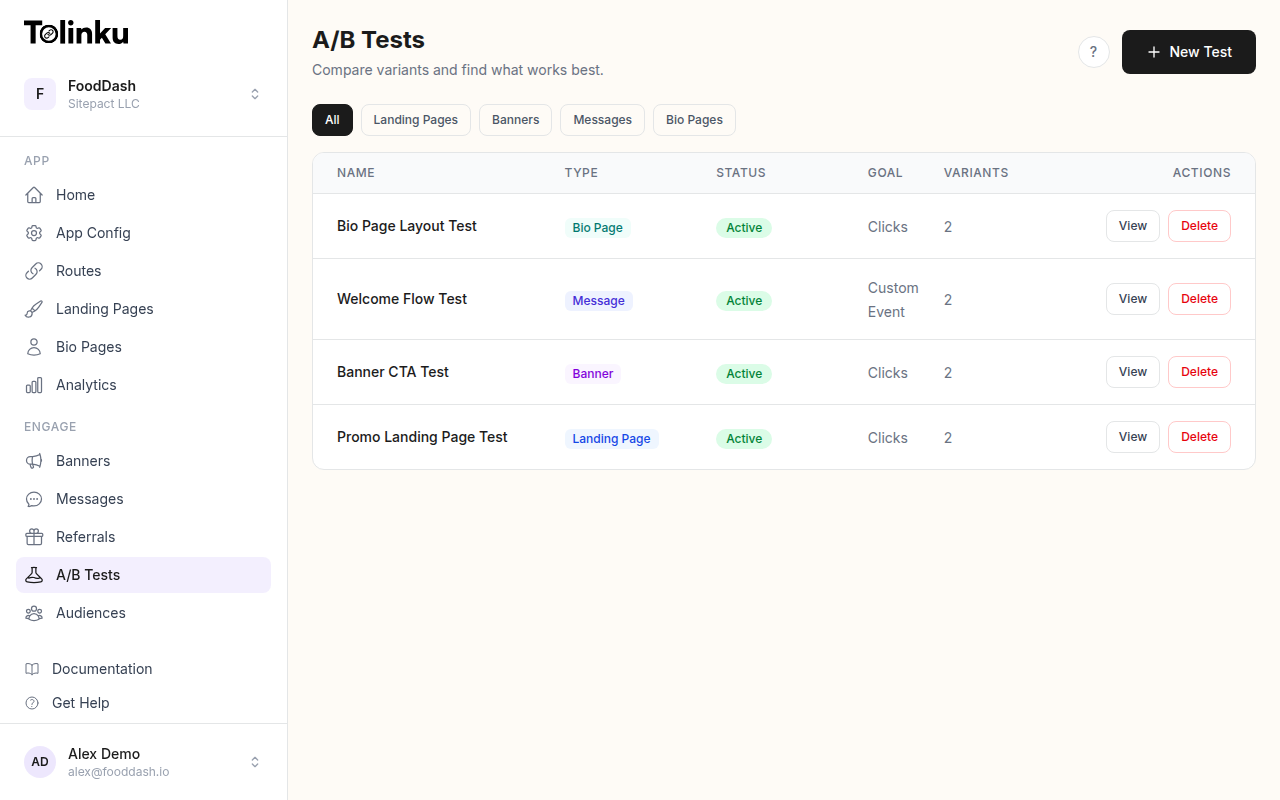
Running the Test in Tolinku
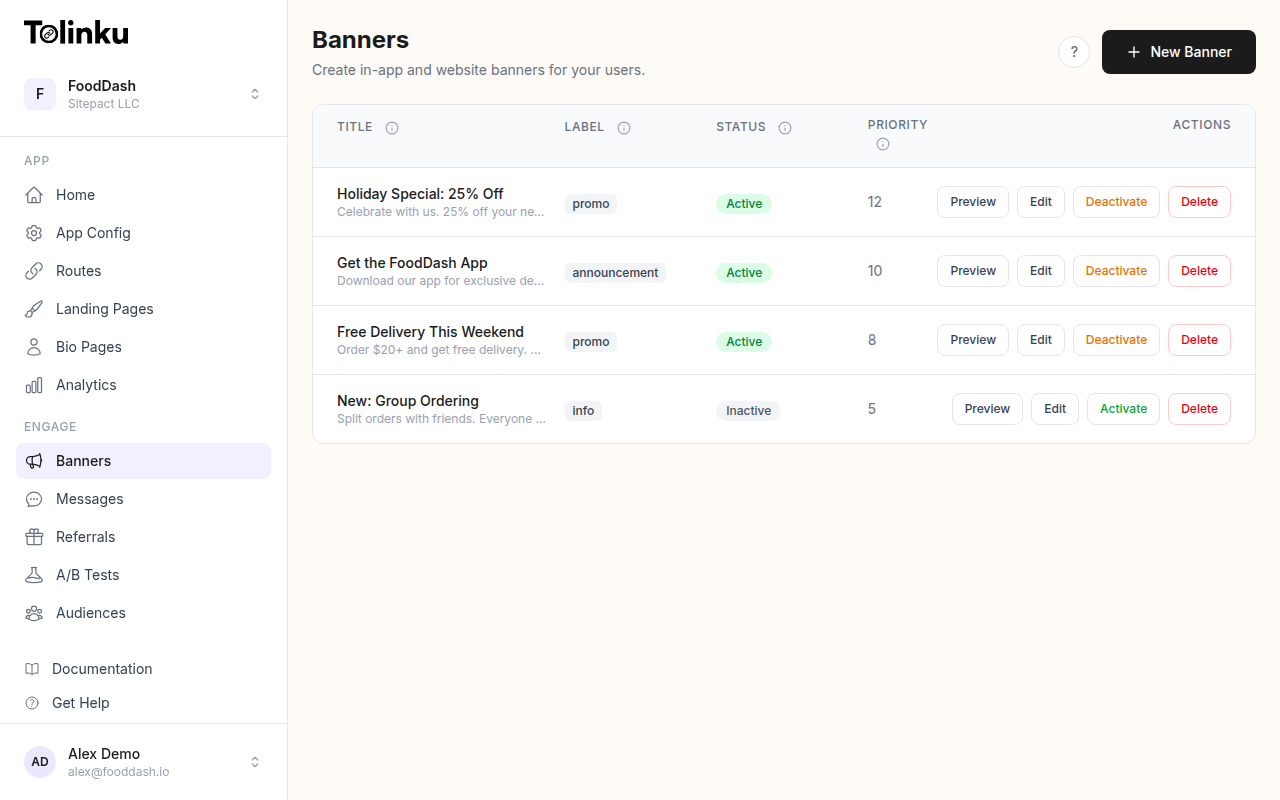
The Tolinku A/B testing feature is built specifically for smart banner experiments. You create a base banner configuration and then add variants that override specific fields.
Setup process:
- Create your control banner with the current best-performing configuration
- Add a variant, changing only the variable you are testing
- Set the traffic split (50/50 is standard; you can weight differently if you want to protect more users from a potentially worse variant)
- Define the success metric (CTR, install events, or a custom conversion)
- Set a minimum runtime and a maximum runtime so the test does not run indefinitely
The system handles the random assignment, impression counting, and statistical calculations. When the test reaches significance, you see the result in the analytics dashboard alongside the confidence interval for each variant.
How to Read the Results
When the test ends, you get a winner (or a non-significant result). How you interpret either matters.
If variant B wins: Roll it out as the new control. Then formulate the next hypothesis and test again. Do not stop at one test. Conversion optimization is a continuous process, not a one-time project.
If the result is not statistically significant: This means you cannot conclude that the variants are different. Do not declare a winner based on directional results. Either run more traffic to reach significance, or accept that the change does not matter and test something else.
If variant A (control) wins: This happens. It means your hypothesis was wrong. That is still valuable information. Document the reasoning, note that users preferred the original, and use that to inform the next hypothesis.
Watch for interaction effects: Sometimes a change that performs well on iOS performs poorly on Android, or well for new users but poorly for returning users. If your overall result is non-significant but you notice a strong directional result in a segment, that is worth investigating in a follow-up test scoped to that segment.
A/B Testing CTA Copy: Starting Points
If you are not sure where to start, CTA copy is consistently the highest-leverage first test. Here are hypothesis pairs organized by app category:
E-commerce:
- Control: "Get the App"
- Variant: "Shop deals in the app"
Food delivery:
- Control: "Download Now"
- Variant: "Order faster in the app"
Finance:
- Control: "Open in App"
- Variant: "Check your balance"
Travel:
- Control: "Get the App"
- Variant: "Manage your trip in-app"
Media / streaming:
- Control: "Open App"
- Variant: "Watch offline with the app"
In each case, the variant trades the generic action verb for a specific benefit. This pattern wins more often than not, but you should still run the test rather than assuming.
Connecting Banner Tests to the Broader Funnel
The banner is one step in a funnel: web visit, banner impression, banner click, app store visit, install, first session, retained user. Optimizing the banner in isolation can produce misleading results if you do not track the full funnel.
A banner that increases CTR by 20% but decreases the install-to-retained-user rate by 30% is a net loss. The extra clicks came from users who were not a good fit for the app.
Connect your banner analytics to your app analytics so you can trace banner impressions through to retained users, not just to clicks. The Tolinku analytics documentation covers how to set up attribution events that link banner clicks to downstream install and retention events.
For a broader view of how to measure deep link performance across the funnel, see the deep link analytics guide.
The teams that get the most from banner testing are the ones who treat it as a repeatable system: form a hypothesis, run the test to significance, ship the winner, and start the next test immediately. Over six to twelve months of continuous iteration, the cumulative improvement in install rate from a web visit can be substantial.
Get deep linking tips in your inbox
One email per week. No spam.