When you launch a campaign, share a QR code at an event, or send a push notification to 500,000 users, you need to know within minutes whether the deep links are working. A real-time analytics dashboard shows live click data, conversion rates, and error rates as they happen, letting you catch problems (broken links, misconfigured routes, unexpected traffic spikes) before they cost you users.
This guide covers building real-time analytics dashboards for deep links. For deep link analytics broadly, see deep link analytics: measuring what matters. For attribution dashboards, see building attribution dashboards.
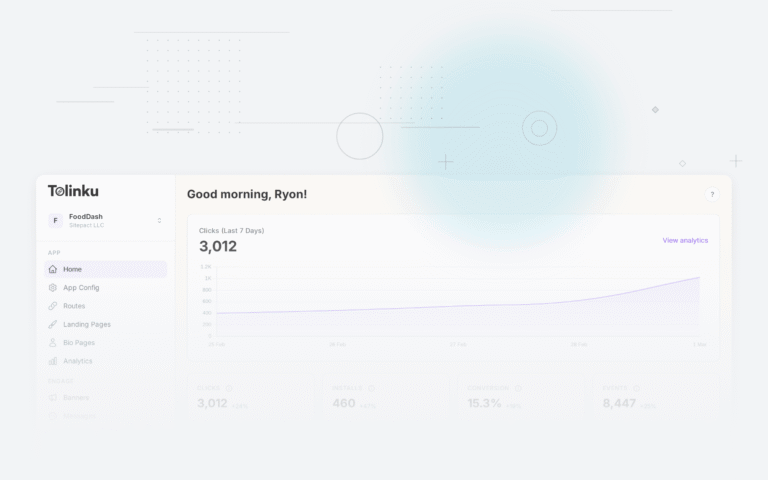
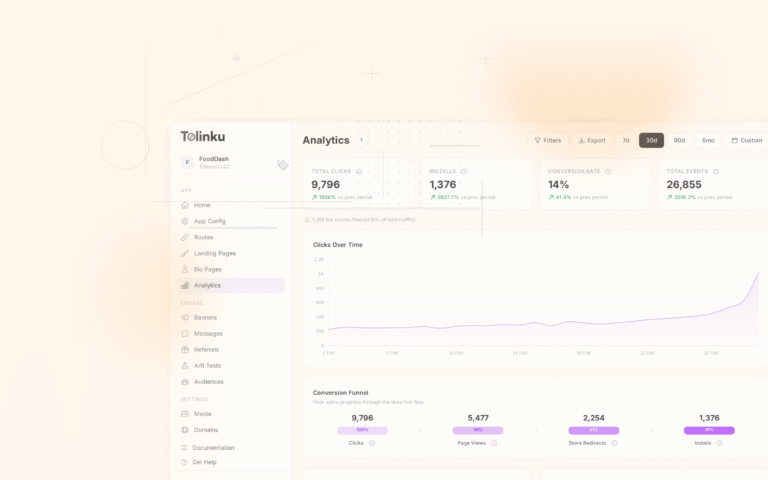
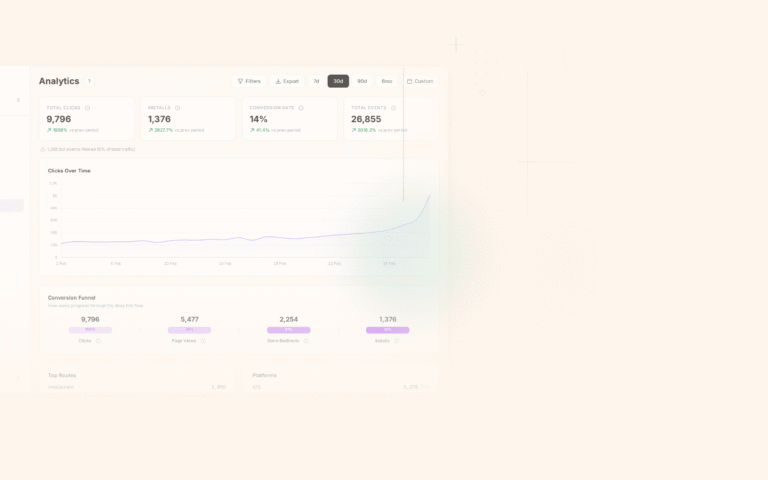
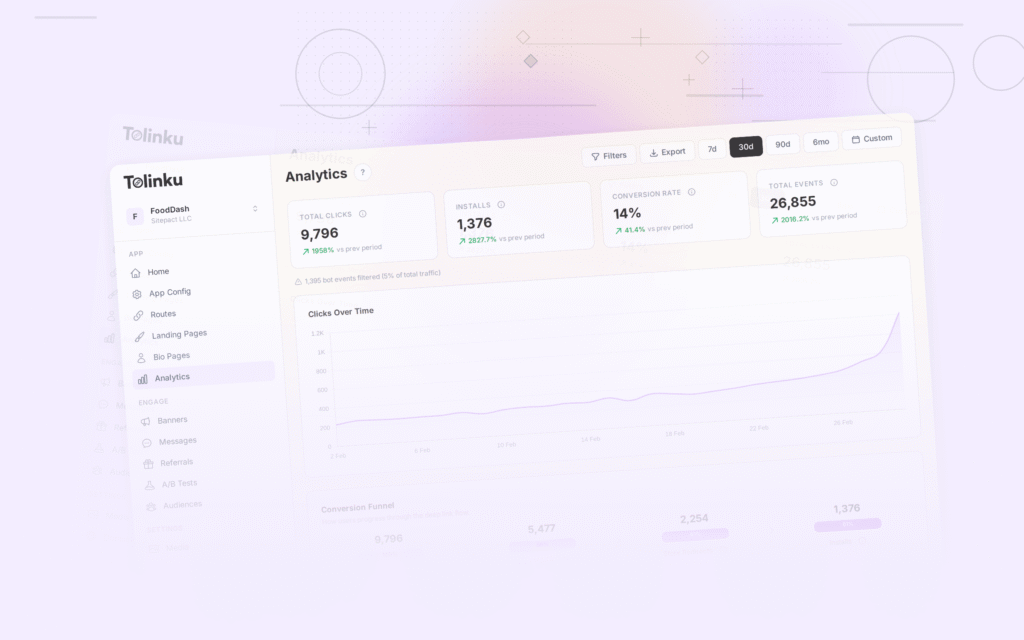
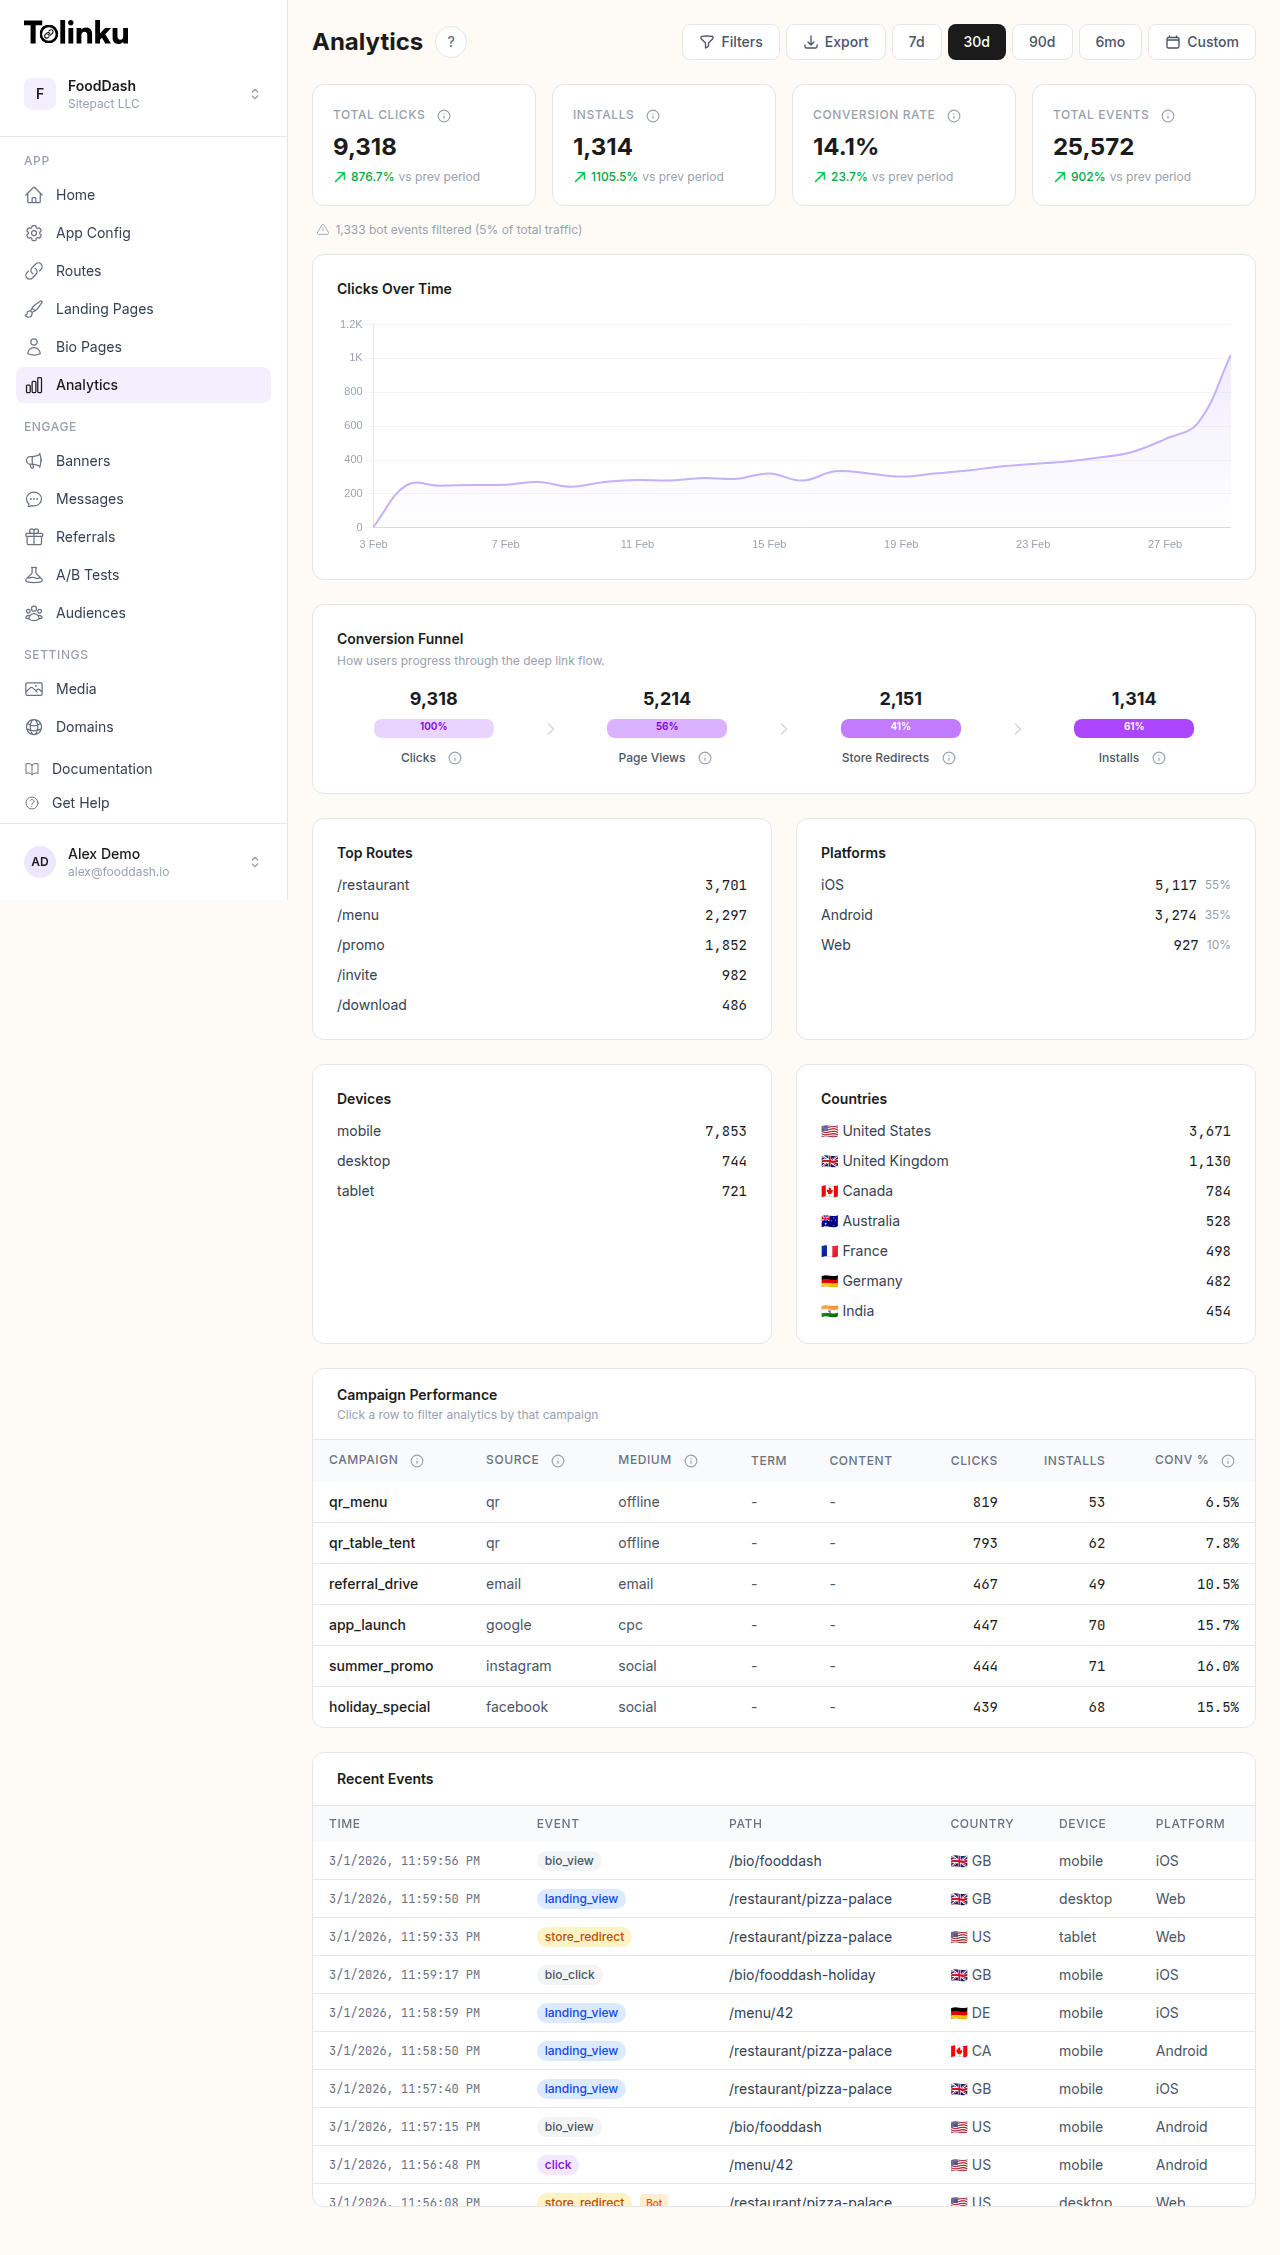 The analytics dashboard with date range selector, filters, charts, and breakdowns.
What to Monitor in Real-Time
Click Metrics
| Metric | Description | Alert Threshold |
|---|---|---|
| Clicks per minute | Total deep link clicks | Drop > 50% from baseline |
| App open rate | % of clicks that opened the app | Below 60% |
| Fallback rate | % of clicks that hit the web fallback | Above 30% |
| Store redirect rate | % of clicks sent to the app store | Spike above normal |
| Error rate | % of clicks that failed to resolve | Above 1% |
Route Metrics
| Metric | Description | Alert Threshold |
|---|---|---|
| Route resolution success | % of clicks routed to the correct screen | Below 95% |
| 404 rate | Clicks to non-existent routes | Above 0.5% |
| Route latency | Time from click to app open | Above 2 seconds |
Campaign Metrics
| Metric | Description | Use Case |
|---|---|---|
| Campaign clicks (live) | Clicks per campaign in the last hour | Launch monitoring |
| Geographic distribution | Clicks by country/city | Geo-targeted campaign verification |
| Device distribution | iOS vs Android vs web | Platform balance |
| Referrer breakdown | Clicks by source (email, social, QR) | Channel monitoring |
Dashboard Layout
Live Overview
┌──────────────────────────────────────────────────────┐
│ LIVE DEEP LINK METRICS (Last 60 minutes)             │
│ ┌──────────┐ ┌──────────┐ ┌──────────┐ ┌──────────┐ │
│ │ Clicks   │ │ App Open │ │ Fallback │ │ Errors   │ │
│ │ 1,247    │ │ Rate     │ │ Rate     │ │          │ │
│ │ +15%     │ │ 72%      │ │ 20%      │ │ 0.3%     │ │
│ └──────────┘ └──────────┘ └──────────┘ └──────────┘ │
├──────────────────────────────────────────────────────┤
│ CLICKS PER MINUTE (sparkline, last 60 min)           │
│ ▁▂▃▄▅▆▇█▇▆▅▅▆▇█▇▆▅▄▃▃▄▅▆▇▇▆▅▄▃▂▂▃▄▅▆▇████▇▆▅▄   │
├──────────────────────────────────────────────────────┤
│ TOP ROUTES (LIVE)          │ TOP CAMPAIGNS (LIVE)     │
│ /products/PROD-123: 234    │ summer-sale: 456         │
│ /offers/OFFER-456: 189     │ email-jul-17: 312        │
│ /referral: 145             │ social-promo: 198        │
│ /home: 98                  │ qr-event: 89             │
├────────────────────────────┴─────────────────────────┤
│ GEOGRAPHIC HEATMAP (live clicks by region)           │
│ [World map with click density]                       │
└──────────────────────────────────────────────────────┘
Campaign Launch View
A focused view for monitoring a specific campaign launch:
┌──────────────────────────────────────────────────────┐
│ CAMPAIGN: summer-sale-2026 (Launched 45 min ago)     │
│ ┌──────────┐ ┌──────────┐ ┌──────────┐ ┌──────────┐ │
│ │ Clicks   │ │ App Open │ │ Installs │ │ Convers. │ │
│ │ 4,521    │ │ 3,245    │ │ 412      │ │ 189      │ │
│ │ 72%      │ │ rate     │ │ new user │ │ purchase │ │
│ └──────────┘ └──────────┘ └──────────┘ └──────────┘ │
├──────────────────────────────────────────────────────┤
│ CLICK TIMELINE (cumulative since launch)             │
│ [Line chart showing click accumulation]              │
├──────────────────────────────────────────────────────┤
│ PLATFORM SPLIT           │ SOURCE SPLIT              │
│ iOS: 58%                 │ Email: 62%                │
│ Android: 34%             │ Push: 28%                 │
│ Web: 8%                  │ Social: 10%               │
└──────────────────────────────────────────────────────┘
Implementation
Streaming Architecture
Deep Link Click → Click Tracker → Event Stream → Dashboard
                                      ↓
                                 Aggregator
                                      ↓
                                 Time-Series DB
Click Event Stream
interface ClickEvent {
  clickId: string;
  linkId: string;
  route: string;
  campaign: string | null;
  source: string | null;
  platform: 'ios' | 'android' | 'web';
  country: string;
  city: string;
  outcome: 'app_opened' | 'fallback' | 'store_redirect' | 'error';
  timestamp: number;
  latencyMs: number;
}

// Publish to event stream
async function trackClick(event: ClickEvent) {
  // Write to time-series database for dashboards
  await timeseriesDB.write('deep_link_clicks', {
    tags: {
      route: event.route,
      campaign: event.campaign || 'none',
      platform: event.platform,
      country: event.country,
      outcome: event.outcome
    },
    fields: {
      count: 1,
      latency_ms: event.latencyMs
    },
    timestamp: event.timestamp
  });

  // Publish to WebSocket for live dashboard
  await wsServer.broadcast('click', {
    route: event.route,
    campaign: event.campaign,
    platform: event.platform,
    outcome: event.outcome,
    timestamp: event.timestamp
  });
}
Live Counter Service
class LiveCounters {
  private redis: Redis;

  async increment(dimensions: Record<string, string>) {
    const now = Math.floor(Date.now() / 1000);
    const minuteBucket = Math.floor(now / 60) * 60;

    // Per-minute counter for sparkline
    const minuteKey = `clicks:minute:${minuteBucket}`;
    await this.redis.incr(minuteKey);
    await this.redis.expire(minuteKey, 7200); // 2 hours

    // Per-dimension counters for breakdowns
    for (const [dim, val] of Object.entries(dimensions)) {
      const dimKey = `clicks:${dim}:${val}:${minuteBucket}`;
      await this.redis.incr(dimKey);
      await this.redis.expire(dimKey, 7200);
    }
  }

  async getSparkline(minutes: number = 60): Promise<number[]> {
    const now = Math.floor(Date.now() / 1000);
    const keys = [];

    for (let i = minutes - 1; i >= 0; i--) {
      const bucket = Math.floor((now - i * 60) / 60) * 60;
      keys.push(`clicks:minute:${bucket}`);
    }

    const values = await this.redis.mget(keys);
    return values.map(v => parseInt(v || '0'));
  }
}
Alerting
Anomaly Detection
interface AlertConfig {
  metric: string;
  type: 'threshold' | 'anomaly' | 'absence';
  window: number; // minutes
  channels: string[];
}

const alerts: AlertConfig[] = [
  {
    // Click rate dropped significantly
    metric: 'clicks_per_minute',
    type: 'anomaly',
    window: 15,
    channels: ['slack', 'email']
  },
  {
    // Error rate spiked
    metric: 'error_rate',
    type: 'threshold',
    window: 5,
    channels: ['slack', 'pagerduty']
  },
  {
    // No clicks at all (link might be broken)
    metric: 'clicks_per_minute',
    type: 'absence',
    window: 10,
    channels: ['slack']
  }
];

function checkAnomaly(current: number, baseline: number, threshold: number = 0.5): boolean {
  if (baseline === 0) return current === 0; // No baseline, no anomaly
  const deviation = Math.abs(current - baseline) / baseline;
  return deviation > threshold; // More than 50% deviation
}
Use Cases
Campaign Launch
When a marketing team sends a push notification to 500,000 users at 10:00 AM:
- Expect a spike in clicks starting at 10:00.
- Monitor app open rate (should be > 70% for push).
- Watch for error rates (misconfigured route?).
- Track conversion rate in real-time (are users completing the intended action?).
Event QR Code
When a QR code is displayed at a conference:
- Monitor click volume to gauge engagement.
- Track geographic concentration (should match the event location).
- Watch fallback rate (high fallback means attendees do not have the app).
Bug Detection
If the app open rate suddenly drops from 70% to 30%:
- A new app version might have broken Universal Link handling.
- The AASA file might have been updated incorrectly.
- A CDN configuration change might be blocking the well-known file.
Real-time monitoring catches these issues within minutes instead of days.
Tolinku Analytics Dashboard
Tolinku's analytics dashboard provides real-time deep link click tracking with route, campaign, platform, and geographic breakdowns. View live metrics in the Tolinku dashboard. For click tracking on short links, see short link click tracking.
For deep link analytics, see deep link analytics: measuring what matters. For attribution dashboards, see building attribution dashboards.
Get deep linking tips in your inbox
One email per week. No spam.