Marketing teams need answers, not data. "How many people clicked the deep link?" is not a useful metric on its own. "The email campaign drove 2,050 conversions at $4.88 CPA, outperforming paid social by 3x" is actionable. Deep link analytics give marketing teams the data to calculate ROI, compare channels, and allocate budget.
This guide covers deep link analytics for marketing teams. For product-focused analytics, see deep link analytics for product teams. For campaign reporting templates, see campaign performance reports for deep links.
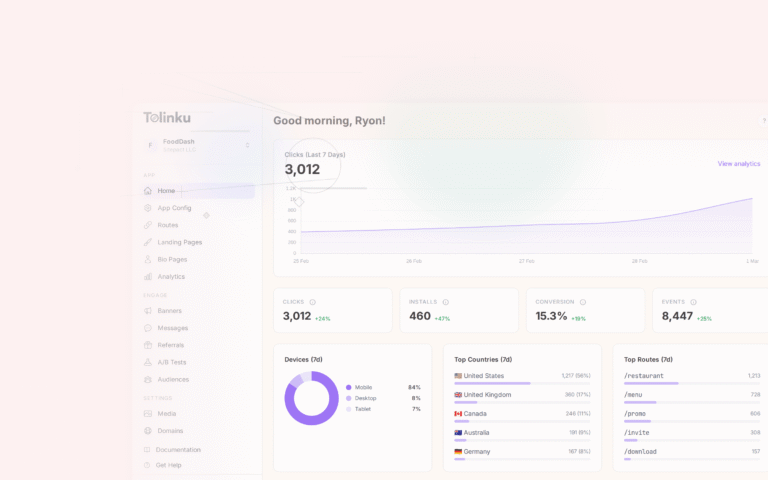
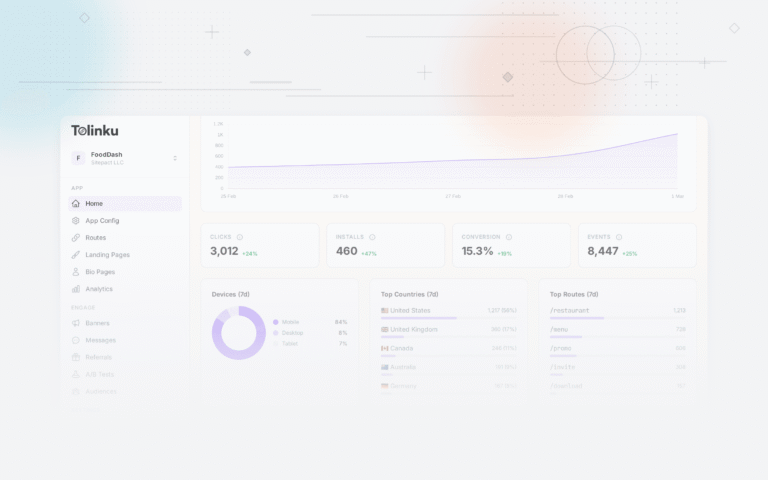
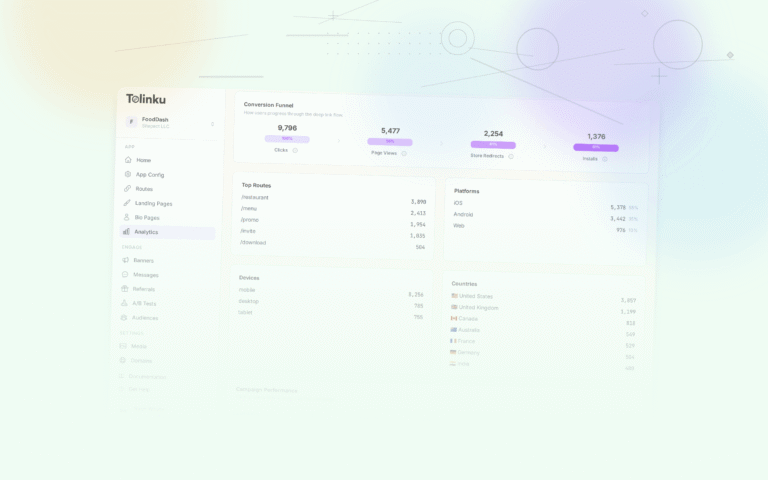
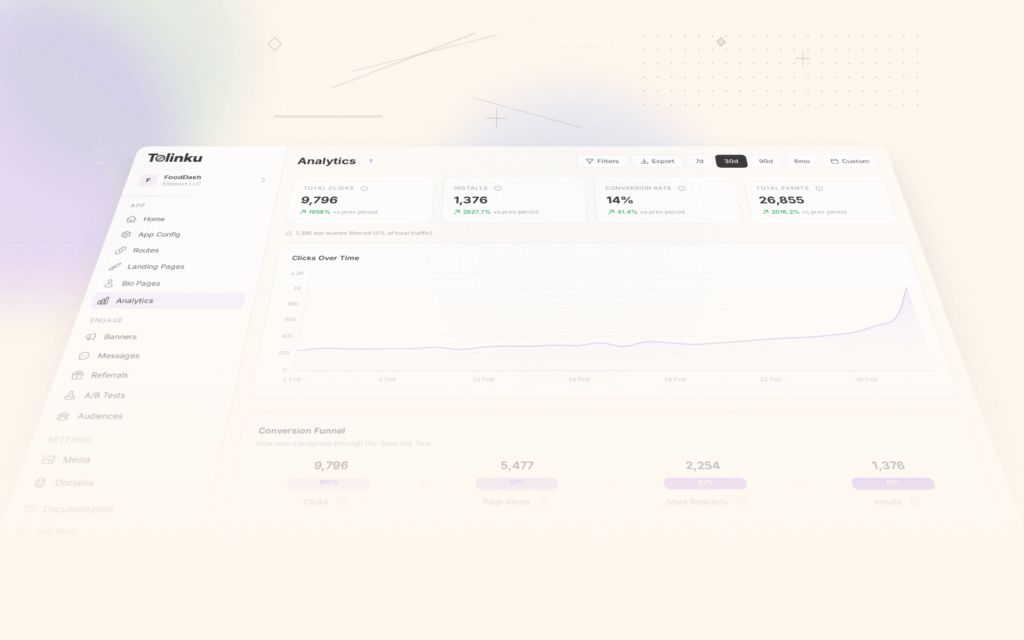
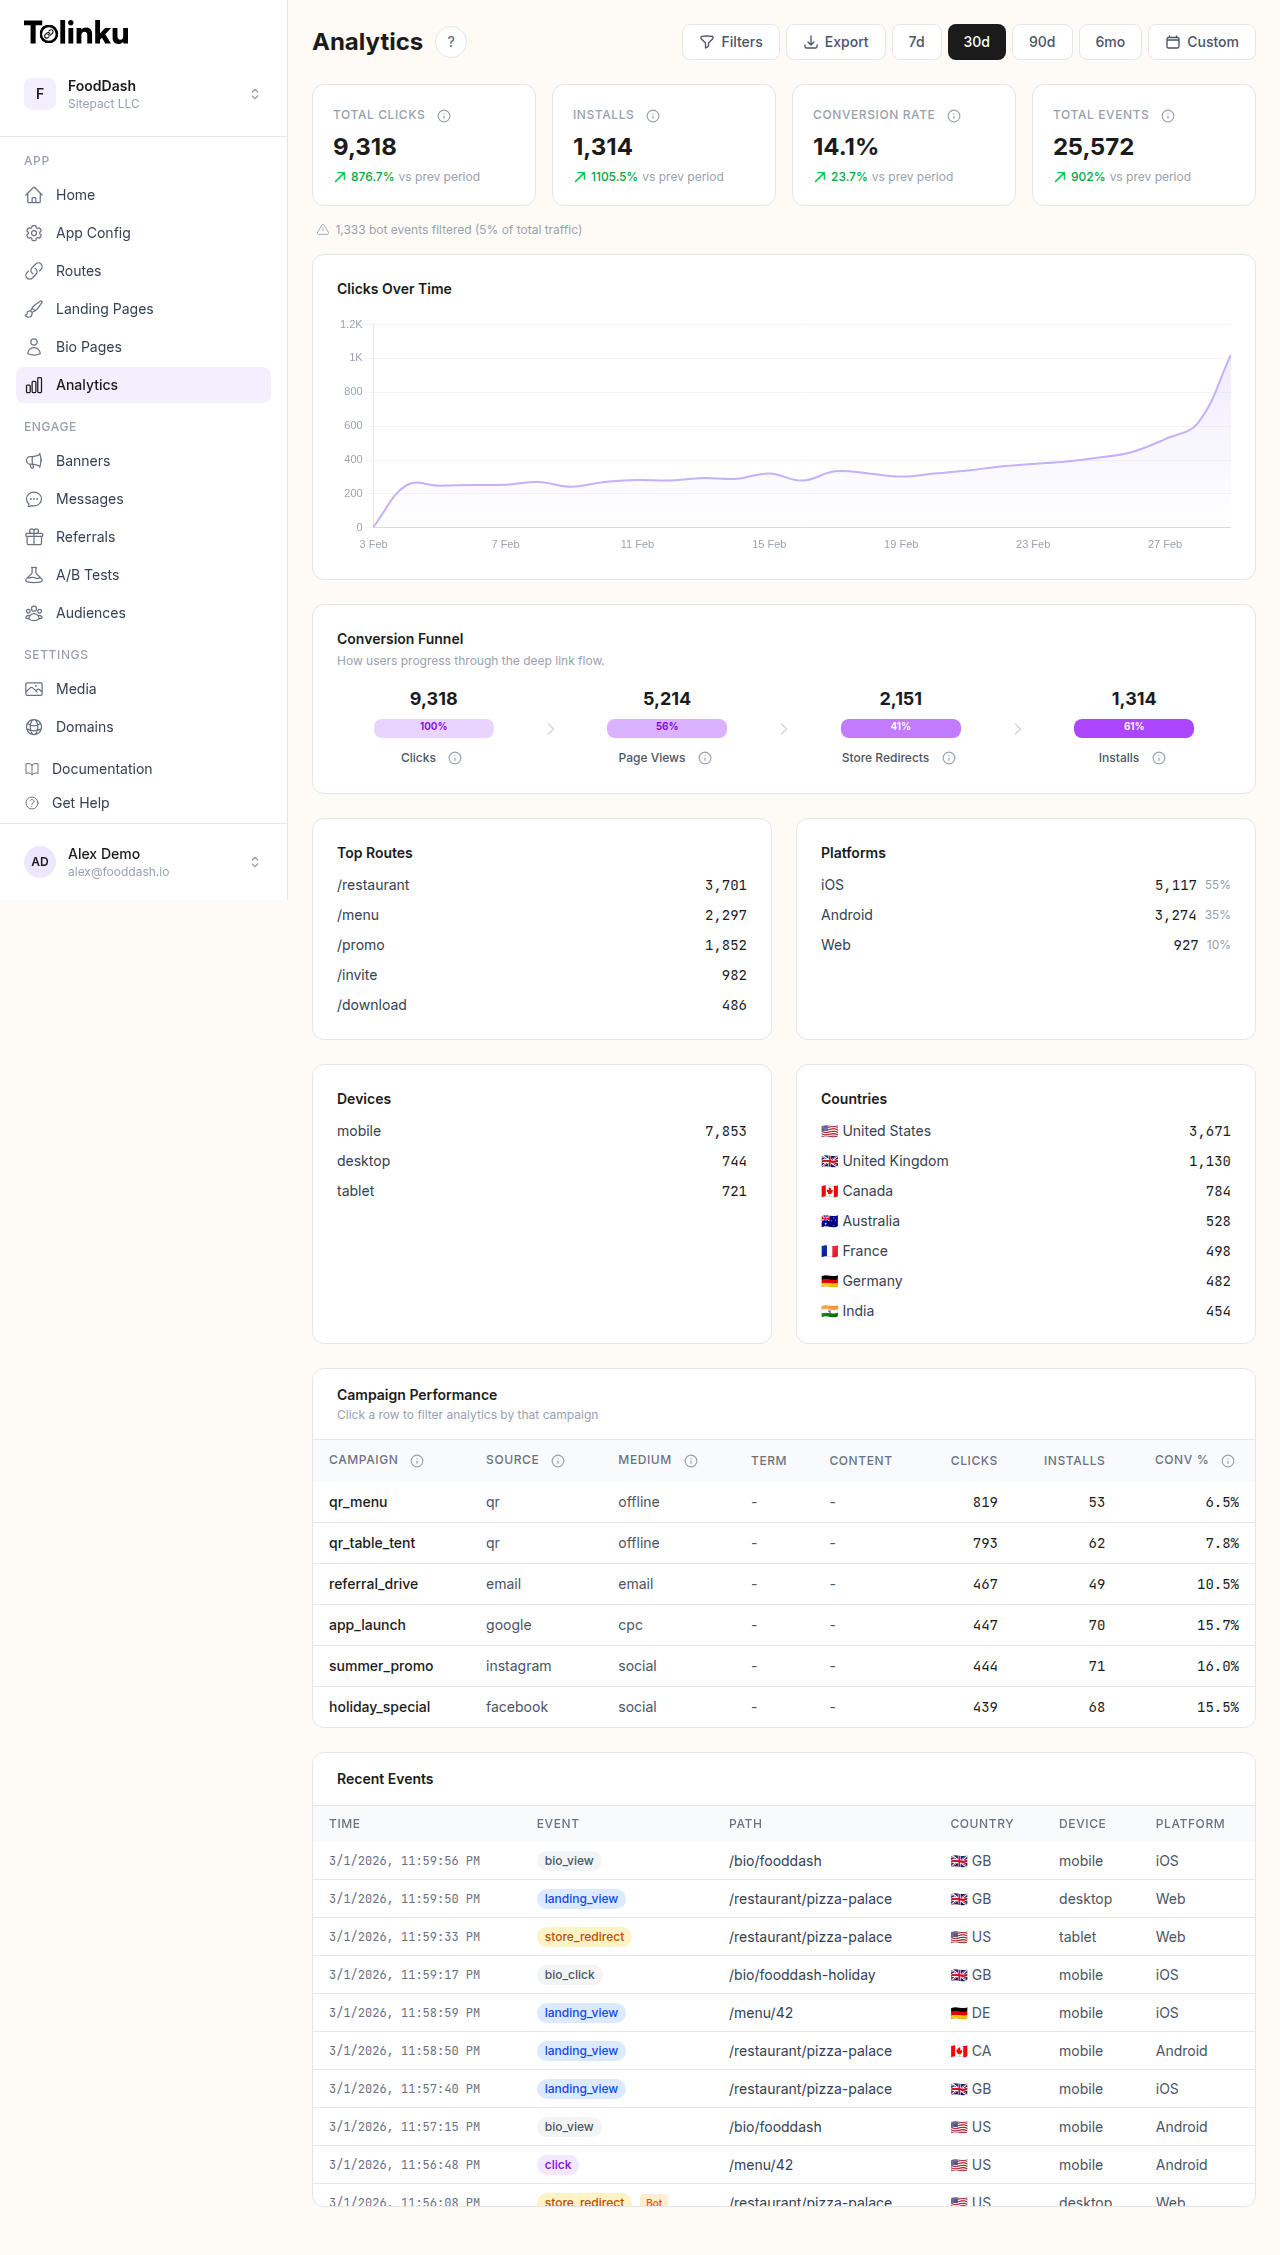 The analytics dashboard with date range selector, filters, charts, and breakdowns.
Metrics Marketing Teams Need
The Marketing Funnel
Deep links create a measurable funnel from impression to conversion:
| Stage | Metric | What It Tells You |
|---|---|---|
| Awareness | Impressions | How many people saw the link |
| Interest | Click-through rate (CTR) | How compelling the message is |
| Engagement | App open rate | How well the deep link works technically |
| Action | Conversion rate | How relevant the landing experience is |
| Value | Revenue per click | How much each click is worth |
Key Metrics by Channel
| Channel | Primary Metric | Secondary Metric | Optimization Target |
|---|---|---|---|
| CTR | Conversion rate | Subject line, CTA copy | |
| Push | Tap rate | Action completion | Timing, personalization |
| Paid social | Cost per install (CPI) | ROAS | Audience targeting, creative |
| Organic social | Shares | Viral coefficient | Content quality, share mechanics |
| QR code | Scan rate | Conversion rate | Placement, CTA on physical media |
| SMS | CTR | Conversion rate | Message copy, timing |
Campaign Dashboard
Essential Dashboard Components
A marketing team dashboard should answer: "How are our campaigns performing?"
1. Campaign Summary Cards
| Campaign | Status | Clicks | Conversions | CPA | ROAS |
|---|---|---|---|---|---|
| Summer Sale | Active | 12,000 | 1,440 | $6.94 | 245% |
| Referral Program | Active | 5,200 | 936 | $0 | N/A |
| Re-engagement | Active | 8,500 | 850 | $8.24 | 180% |
| Back to School | Scheduled | 0 | 0 | – | – |
2. Channel Comparison
SELECT
  source AS channel,
  COUNT(*) AS clicks,
  SUM(CASE WHEN outcome = 'app_opened' THEN 1 ELSE 0 END) AS app_opens,
  ROUND(SUM(CASE WHEN outcome = 'app_opened' THEN 1 ELSE 0 END)::DECIMAL / COUNT(*) * 100, 1) AS open_rate,
  SUM(CASE WHEN converted THEN 1 ELSE 0 END) AS conversions,
  ROUND(SUM(CASE WHEN converted THEN 1 ELSE 0 END)::DECIMAL /
    NULLIF(SUM(CASE WHEN outcome = 'app_opened' THEN 1 ELSE 0 END), 0) * 100, 1) AS conv_rate,
  ROUND(SUM(spend)::DECIMAL / NULLIF(SUM(CASE WHEN converted THEN 1 ELSE 0 END), 0), 2) AS cpa,
  ROUND(SUM(revenue)::DECIMAL / NULLIF(SUM(spend), 0) * 100, 0) AS roas_pct
FROM campaign_performance
WHERE campaign = 'summer-sale'
GROUP BY source
ORDER BY conversions DESC;
3. Daily Trend Line
Track clicks, conversions, and spend over time to spot trends and anomalies. A sudden drop in clicks from email may mean deliverability issues. A spike in paid social clicks without a corresponding conversion spike means targeting is off.
Channel ROI Analysis
Calculating ROAS by Channel
Return on ad spend tells you which channels are profitable:
SELECT
  source,
  medium,
  SUM(spend) AS total_spend,
  SUM(revenue) AS total_revenue,
  SUM(CASE WHEN converted THEN 1 ELSE 0 END) AS conversions,
  ROUND(SUM(revenue)::DECIMAL / NULLIF(SUM(spend), 0) * 100, 0) AS roas_pct,
  ROUND(SUM(spend)::DECIMAL / NULLIF(SUM(CASE WHEN converted THEN 1 ELSE 0 END), 0), 2) AS cpa
FROM campaign_performance
WHERE timestamp >= '2026-07-01'
GROUP BY source, medium
ORDER BY roas_pct DESC;
| Channel | Medium | Spend | Revenue | Conversions | ROAS | CPA |
|---|---|---|---|---|---|---|
| Newsletter | $2,000 | $8,200 | 410 | 410% | $4.88 | |
| Push | Notification | $500 | $1,750 | 175 | 350% | $2.86 |
| QR | $1,500 | $3,600 | 120 | 240% | $12.50 | |
| Paid | $5,000 | $7,250 | 200 | 145% | $25.00 | |
| Paid | $3,000 | $2,700 | 90 | 90% | $33.33 |
Instagram paid ads are below breakeven (90% ROAS). Either optimize the targeting, improve the landing experience, or reallocate budget to email and push.
Attribution Windows
How long after a deep link click should you attribute conversions?
| Window | Typical Use | Trade-off |
|---|---|---|
| 1 hour | Immediate actions (purchases, sign-ups) | Misses delayed conversions |
| 24 hours | Standard for most campaigns | Good balance |
| 7 days | Re-engagement, consideration products | May over-attribute |
| 30 days | High-consideration purchases (travel, finance) | Risk of false attribution |
Use shorter windows for impulse purchases and longer windows for products with research cycles.
A/B Testing with Deep Links
Testing Link Variations
Deep links make A/B testing straightforward because each link variant can point to a different experience:
| Test Element | Variant A | Variant B | Winner |
|---|---|---|---|
| Landing screen | Product list | Featured product | B (22% higher conversion) |
| CTA button | "Shop Now" | "See Your Offer" | B (15% higher CTR) |
| Offer type | % discount | $ off | A (8% higher AOV) |
| Personalization | Generic greeting | Name + history | B (30% higher conversion) |
Measuring Test Results
SELECT
  campaign,
  variant,
  COUNT(*) AS clicks,
  SUM(CASE WHEN converted THEN 1 ELSE 0 END) AS conversions,
  ROUND(SUM(CASE WHEN converted THEN 1 ELSE 0 END)::DECIMAL / COUNT(*) * 100, 2) AS conv_rate,
  ROUND(AVG(CASE WHEN converted THEN revenue END), 2) AS avg_order_value
FROM ab_test_results
WHERE campaign = 'summer-sale-landing-test'
GROUP BY campaign, variant;
| Variant | Clicks | Conversions | Conv Rate | Avg Order Value |
|---|---|---|---|---|
| A (product list) | 3,200 | 384 | 12.00% | $42.50 |
| B (featured product) | 3,150 | 462 | 14.67% | $38.20 |
Variant B has a higher conversion rate, but Variant A has a higher average order value. Revenue per click: A = $5.10, B = $5.61. Variant B wins on revenue per click.
Audience Segmentation
Segmenting by Deep Link Behavior
Group your audience by how they interact with deep links:
| Segment | Definition | Strategy |
|---|---|---|
| Active clickers | Clicked 3+ deep links in 30 days | Send more targeted deep links |
| One-time clickers | Clicked 1 deep link, did not convert | Re-target with different content |
| Converters | Clicked and converted | Upsell, cross-sell, loyalty |
| Lapsed | No deep link click in 60+ days | Re-engagement campaign |
| Non-clickers | Received links but never clicked | Try different channels or timing |
Performance by Segment
SELECT
  segment,
  COUNT(*) AS users,
  ROUND(AVG(clicks_30d), 1) AS avg_clicks,
  ROUND(AVG(conversions_30d), 2) AS avg_conversions,
  ROUND(AVG(revenue_30d), 2) AS avg_revenue,
  ROUND(AVG(ltv), 2) AS avg_ltv
FROM user_segments
GROUP BY segment
ORDER BY avg_ltv DESC;
Budget Allocation
Data-Driven Budget Decisions
Use deep link analytics to decide where to spend:
SELECT
  source,
  SUM(spend) AS current_spend,
  SUM(revenue) AS revenue,
  ROUND(SUM(revenue)::DECIMAL / NULLIF(SUM(spend), 0), 2) AS roas,
  ROUND(SUM(spend)::DECIMAL / NULLIF(SUM(CASE WHEN converted THEN 1 ELSE 0 END), 0), 2) AS cpa,
  -- Marginal efficiency: would more spend on this channel be profitable?
  CASE
    WHEN SUM(revenue)::DECIMAL / NULLIF(SUM(spend), 0) > 2.0 THEN 'Increase budget'
    WHEN SUM(revenue)::DECIMAL / NULLIF(SUM(spend), 0) > 1.0 THEN 'Maintain budget'
    ELSE 'Reduce/cut budget'
  END AS recommendation
FROM campaign_performance
WHERE timestamp >= '2026-07-01'
GROUP BY source
ORDER BY roas DESC;
| Channel | Current Spend | Revenue | ROAS | CPA | Recommendation |
|---|---|---|---|---|---|
| $2,000 | $8,200 | 4.10 | $4.88 | Increase budget | |
| Push | $500 | $1,750 | 3.50 | $2.86 | Increase budget |
| QR codes | $1,500 | $3,600 | 2.40 | $12.50 | Increase budget |
| $5,000 | $7,250 | 1.45 | $25.00 | Maintain budget | |
| $3,000 | $2,700 | 0.90 | $33.33 | Reduce budget |
Diminishing Returns
As you increase spend on a channel, CPA tends to increase (you exhaust the most responsive audience first). Monitor marginal CPA, not just average CPA, to avoid overspending.
Reporting for Stakeholders
Weekly Marketing Report
Keep it short and actionable:
- Headline metric: "Deep link campaigns drove $18,500 in revenue this week, up 12% from last week."
- Channel comparison: Table showing clicks, conversions, CPA, ROAS by channel.
- Top performing campaign: Which campaign drove the most value?
- Underperforming campaign: Which campaign needs attention?
- Next week's plan: 2-3 specific actions based on the data.
Monthly Executive Summary
Executives want business impact:
- Total revenue attributed to deep link campaigns
- ROAS trend (month over month)
- Customer acquisition cost trend
- Top performing channel and recommendation for next month
- One chart: revenue by channel over time
Tolinku for Marketing Analytics
Tolinku's analytics provide campaign-level performance metrics, including clicks, app opens, conversions, and channel breakdowns. View campaign dashboards and funnels in the Tolinku dashboard.
For product team analytics, see deep link analytics for product teams. For campaign reporting, see campaign performance reports for deep links.
Get deep linking tips in your inbox
One email per week. No spam.