Webhooks are straightforward in concept: an event happens, an HTTP POST gets sent to your server. In practice, they are one of the most frustrating things to debug. The request originates from someone else's infrastructure, there is no browser DevTools to inspect, and when something goes wrong the only evidence is a cryptic error in a log (or no log at all).
If you have already set up a webhook endpoint (see the webhook setup guide if you have not), this article covers what to do when things break. We will walk through the most common failure modes, tools for local development, logging strategies that actually help, and monitoring approaches that catch problems before your users notice.
For a broader look at how webhooks fit into deep linking workflows, see the webhooks and integrations overview.
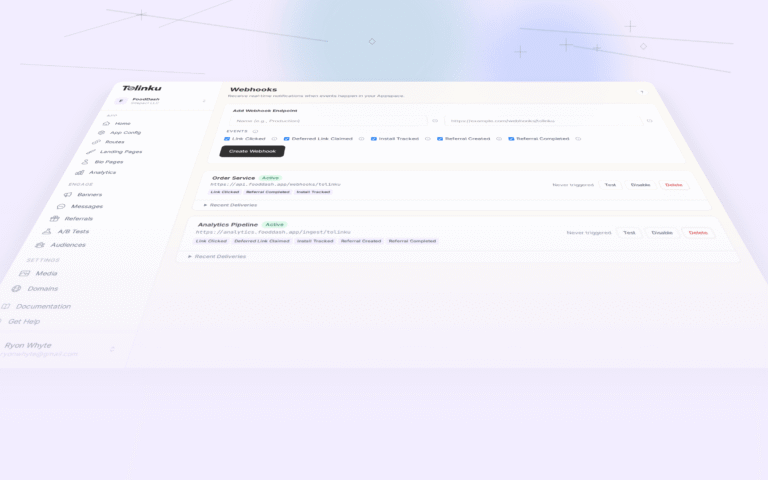
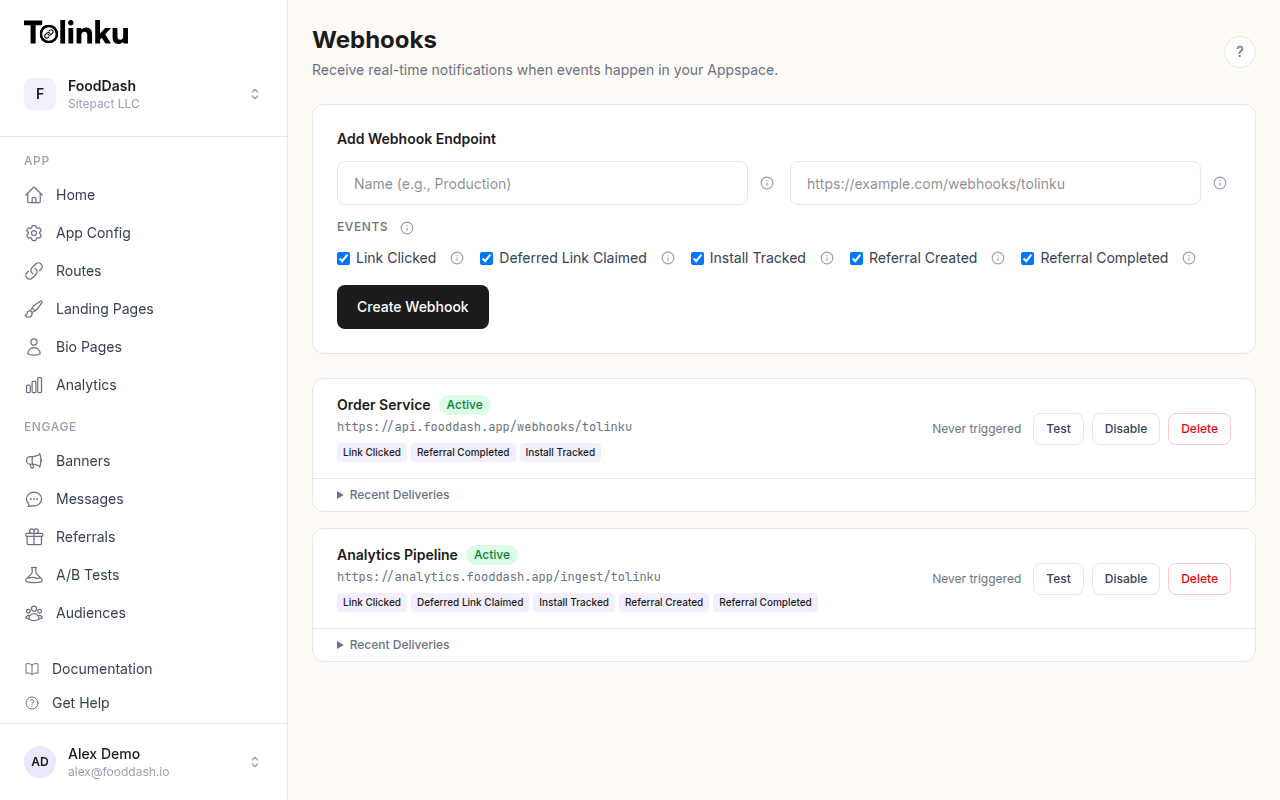 The webhooks page with create form, webhook list, and delivery log.
The Four Categories of Webhook Failures
Almost every webhook issue falls into one of four buckets:
- Delivery failures. The request never reaches your server. DNS issues, firewall rules, TLS errors, or your server being down.
- Signature mismatches. The request arrives but your verification code rejects it. Usually caused by body parsing issues or incorrect secrets.
- Payload parsing errors. The signature checks out but your handler crashes trying to process the payload. Missing fields, unexpected types, or encoding problems.
- Timeouts. Your server receives the request but takes too long to respond. The sending platform marks the delivery as failed and retries.
Knowing which category you are dealing with cuts your debugging time significantly. The Tolinku dashboard's delivery log shows the HTTP status code and response time for every delivery attempt, which tells you immediately whether the problem is on the network side (category 1), in your application logic (categories 2-3), or a performance issue (category 4).
Setting Up Local Development
The biggest obstacle to debugging webhooks is that you cannot receive them on localhost. The sending platform needs a publicly reachable URL. There are several tools that solve this by creating tunnels from the public internet to your local machine.
ngrok
ngrok is the most widely used option. Install it, then run:
ngrok http 3000
This gives you a public URL like https://abc123.ngrok-free.app that forwards to your local port 3000. Copy that URL into the Tolinku dashboard as your webhook endpoint.
ngrok also provides a local inspection UI at http://127.0.0.1:4040 where you can see every request, replay failed deliveries, and inspect headers and bodies. This inspection interface alone makes it worth using during development.
Webhook.site
Webhook.site gives you a temporary public URL that logs incoming requests. It is useful when you want to inspect raw payloads without writing any code. You can see the exact headers, body, and timing of each delivery. The limitation is that it does not forward to your local server, so it is better for inspection than for end-to-end testing.
Other Tunnel Options
Cloudflare Tunnel provides a free tunnel option that works well for longer-lived development environments. localtunnel is an open-source alternative if you want to avoid creating accounts.
Whichever tool you use, the workflow is the same: start your local server, create a tunnel, register the tunnel URL in your Tolinku Appspace's webhook settings, and trigger test events.
Using Test Deliveries
Before debugging with real events, use Tolinku's test delivery feature. In the webhooks page of your Appspace dashboard, each endpoint has a "Send Test" option. This sends a sample payload to your endpoint and reports the result immediately.
Test deliveries are valuable for two reasons. First, they confirm basic connectivity: can the platform reach your endpoint at all? Second, they provide a known-good payload. If your handler works with a test delivery but fails on real events, the problem is in your event-specific processing logic, not in the plumbing.
If a test delivery fails, check the delivery log for the HTTP status code. A 000 or connection error means the platform could not reach your URL. A 4xx or 5xx means your server received the request but responded with an error.
Debugging Signature Mismatches
Signature verification is where most webhook debugging happens. Tolinku signs every webhook delivery using HMAC-SHA256 over the raw request body. The signature is sent in the X-Webhook-Signature header, and the event type is in the X-Webhook-Event header.
Here is a correct verification implementation:
const crypto = require('crypto');

function verifyWebhookSignature(req, secret) {
  const signature = req.headers['x-webhook-signature'];

  if (!signature) {
    return false;
  }

  // Sign the raw request body (not parsed JSON)
  const expected = crypto
    .createHmac('sha256', secret)
    .update(req.body) // req.body is a Buffer from express.raw()
    .digest('hex');

  const sig = Buffer.from(signature, 'hex');
  const exp = Buffer.from(expected, 'hex');

  if (sig.length !== exp.length) return false;

  return crypto.timingSafeEqual(sig, exp
  );
}
The most common cause of signature failures is body parsing. If you use express.json() before your webhook route, Express parses the body into a JavaScript object, and the raw bytes are gone. The HMAC is computed over the raw request body, so you need to preserve it.
The fix is to capture the raw body during parsing:
app.use('/webhooks', express.json({
  verify: (req, res, buf) => {
    req.rawBody = buf.toString('utf-8');
  }
}));
Other common signature issues:
- Wrong secret. Double-check that you are using the webhook signing secret from the Tolinku dashboard, not your API key (which starts with
tolk_sec_ortolk_pub_). The signing secret is specific to each webhook endpoint. - Encoding mismatch. If you are comparing the signature as a base64 string but the platform sends it as hex (or vice versa), verification will always fail. Tolinku uses hex encoding.
- Timestamp not included. The signed payload is
timestamp.body, not justbody. If you forget to prepend the timestamp, the HMAC will not match.
When you are stuck, log both the expected and received signatures (in a development environment only) to see whether they are completely different (wrong secret or wrong payload) or just slightly off (encoding issue).
Debugging Payload Parsing Errors
Once the signature is valid, the next failure point is your handler logic. These errors are usually straightforward but can be tricky to reproduce because they depend on specific event types or data shapes.
A defensive handler pattern:
app.post('/webhooks/tolinku', (req, res) => {
  // Respond immediately to avoid timeout
  res.status(200).json({ received: true });

  try {
    const { event, timestamp, data } = JSON.parse(req.body.toString());

    if (!event || !data) {
      console.error('Malformed webhook payload:', JSON.stringify(req.body));
      return;
    }

    switch (event) {
      case 'link.clicked':
        handleLinkClicked(data);
        break;
      case 'deferred_link.claimed':
        handleLinkOpened(data);
        break;
      case 'install.tracked':
        handleLinkInstalled(data);
        break;
      case 'referral.created':
        handleLinkConverted(data);
        break;
      case 'referral.completed':
        handleLinkReferred(data);
        break;
      default:
        handleCustomEvent(data);
        break;
      default:
        console.warn(`Unhandled webhook event type: ${event}`);
    }
  } catch (err) {
    console.error('Webhook processing error:', err);
  }
});
Key patterns in this code:
- Respond before processing. Send the
200immediately, then process asynchronously. This prevents timeouts even if your handler logic is slow. - Validate the envelope. Check that
eventanddataexist before switching on the event type. - Handle unknown events gracefully. New event types may be added in the future. Log them, but do not crash.
- Catch errors. A thrown exception in a webhook handler is invisible to the sender. Log it so you can find it.
Common parsing problems include assuming a field exists when it is optional, treating numbers as strings (or vice versa), and hardcoding event types without a default case.
Debugging Timeouts
Most webhook platforms expect a response within 5 to 30 seconds. If your handler does heavy processing (database writes, external API calls, image processing), you can easily exceed that window.
The solution is always the same: acknowledge receipt immediately and process the event asynchronously. In Node.js, you can use a simple queue:
const eventQueue = [];

app.post('/webhooks/tolinku', (req, res) => {
  res.status(200).json({ received: true });
  eventQueue.push(req.body);
});

// Process events in the background
setInterval(() => {
  while (eventQueue.length > 0) {
    const event = eventQueue.shift();
    processEvent(event).catch(err => {
      console.error('Failed to process event:', err);
    });
  }
}, 100);
For production systems, replace the in-memory queue with something durable like BullMQ (backed by Redis), a database-backed job queue, or a message broker. The point is to decouple receipt from processing so that delivery never times out.
Logging Strategies That Help
Generic logging tells you something went wrong. Good webhook logging tells you exactly what went wrong and with which delivery.
Log these fields on every webhook receipt:
function logWebhookReceipt(payload) {
  console.log(JSON.stringify({
    type: 'webhook_received',
    event: payload.event,
    event_timestamp: payload.timestamp,
    status: 'received',
    received_at: new Date().toISOString()
  }));
}
Structured JSON logs are critical here. If you are running in production with a log aggregation service (Datadog, Grafana Loki, AWS CloudWatch), structured logs let you filter by event type, search by delivery ID, and correlate webhook receipts with downstream processing errors.
Log again after processing completes (or fails):
function logWebhookProcessed(deliveryId, event, success, error) {
  console.log(JSON.stringify({
    type: 'webhook_processed',
    delivery_id: deliveryId,
    event: event,
    status: success ? 'success' : 'failed',
    error: error ? error.message : null,
    processed_at: new Date().toISOString()
  }));
}
With both log entries, you can quickly answer questions like: "Did we receive the delivery?" and "Did we successfully process it?" These are different questions with different answers, and conflating them is a common debugging pitfall.
Monitoring and Alerting
Logging helps you investigate problems after they occur. Monitoring helps you catch them as they happen.
Track these metrics:
- Delivery success rate. The percentage of incoming webhooks that return a
200response. A sudden drop means something is broken. - Processing success rate. The percentage of received webhooks that your handler processes without error. This can differ from delivery success rate if you respond
200before processing. - Processing latency. How long your handler takes to complete. A gradual increase is an early warning sign.
- Queue depth. If you are using an async queue, monitor its size. A growing queue means you are receiving events faster than you can process them.
Set alerts on the delivery success rate. If it drops below 95% for more than a few minutes, something needs attention. The Tolinku dashboard's webhook delivery log shows failed deliveries from the platform's perspective, but your own monitoring catches failures that happen after the 200 response.
A Debugging Checklist
When a webhook is not working, run through this checklist in order:
- Is the endpoint URL correct? Check for typos, missing paths, and HTTP vs. HTTPS.
- Can the platform reach your server? Use a test delivery from the Tolinku dashboard. Check the delivery log for the response code.
- Is your server running and listening on the right port? If using a tunnel, verify the tunnel is active.
- Is your TLS certificate valid? Expired certificates cause silent connection failures.
- Is the raw body preserved for signature verification? Check your body parsing middleware.
- Are you using the correct signing secret? Not your API key, not another endpoint's secret.
- Does your handler return a response before the timeout? Add logging to measure response time.
- Are you handling the specific event type? Check your switch statement or router for the event in question.
- Is a firewall or WAF blocking the requests? Some security tools block automated POST requests that do not carry a browser user agent.
- Are retries causing duplicate processing? Implement idempotency based on the delivery
idfield.
Work through this list from top to bottom. Most issues resolve within the first three or four items.
Wrapping Up
Debugging webhooks is fundamentally different from debugging a standard API integration. You do not control the request, you cannot easily reproduce it, and failures can be silent. The combination of good local tooling (tunnels and test deliveries), structured logging, and proactive monitoring turns webhook debugging from a guessing game into a systematic process.
Start by using ngrok or Webhook.site during development. Use Tolinku's test delivery feature to verify connectivity and signature verification. Add structured logs that track both receipt and processing. And set up monitoring so you catch failures before your downstream systems go stale.
For more on setting up webhook endpoints from scratch, see the webhook setup guide. For a broader look at building integrations around deep link events, see the webhooks and integrations overview.
Get deep linking tips in your inbox
One email per week. No spam.