A broken AASA file can silently kill your deep link performance for hours before anyone notices. By the time a marketer reports "our email links are not working," thousands of users have already been sent to fallback pages. Alerting catches these problems in minutes instead of hours.
This guide covers how to set up analytics alerts for deep link anomalies. For real-time dashboards, see real-time analytics dashboards for deep links. For webhook integrations, see webhooks and integrations for deep linking.
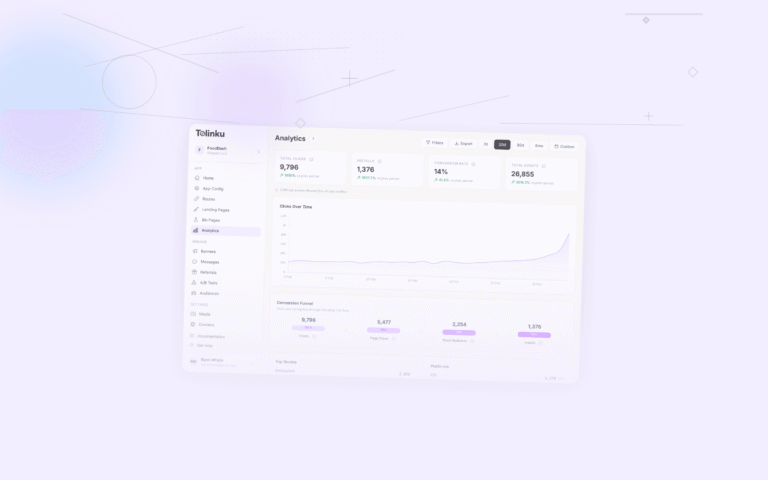
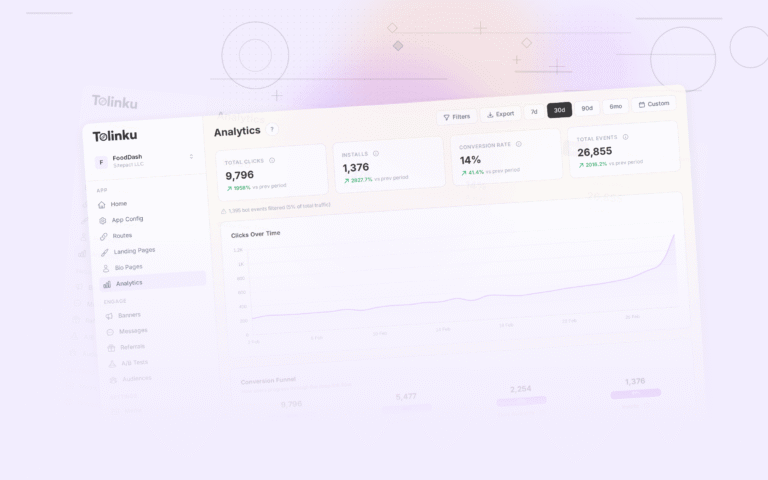
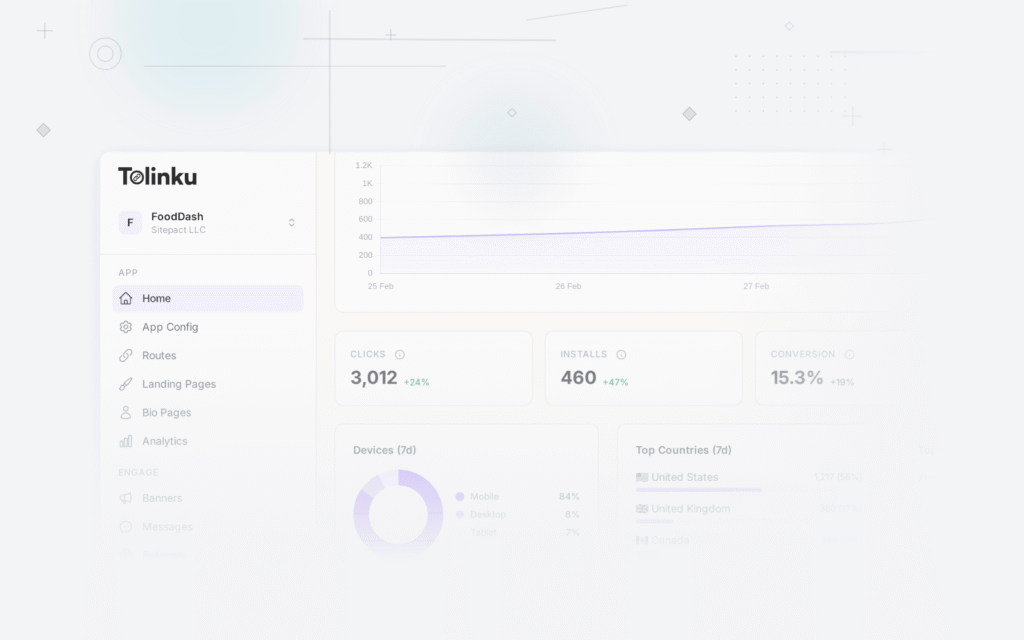
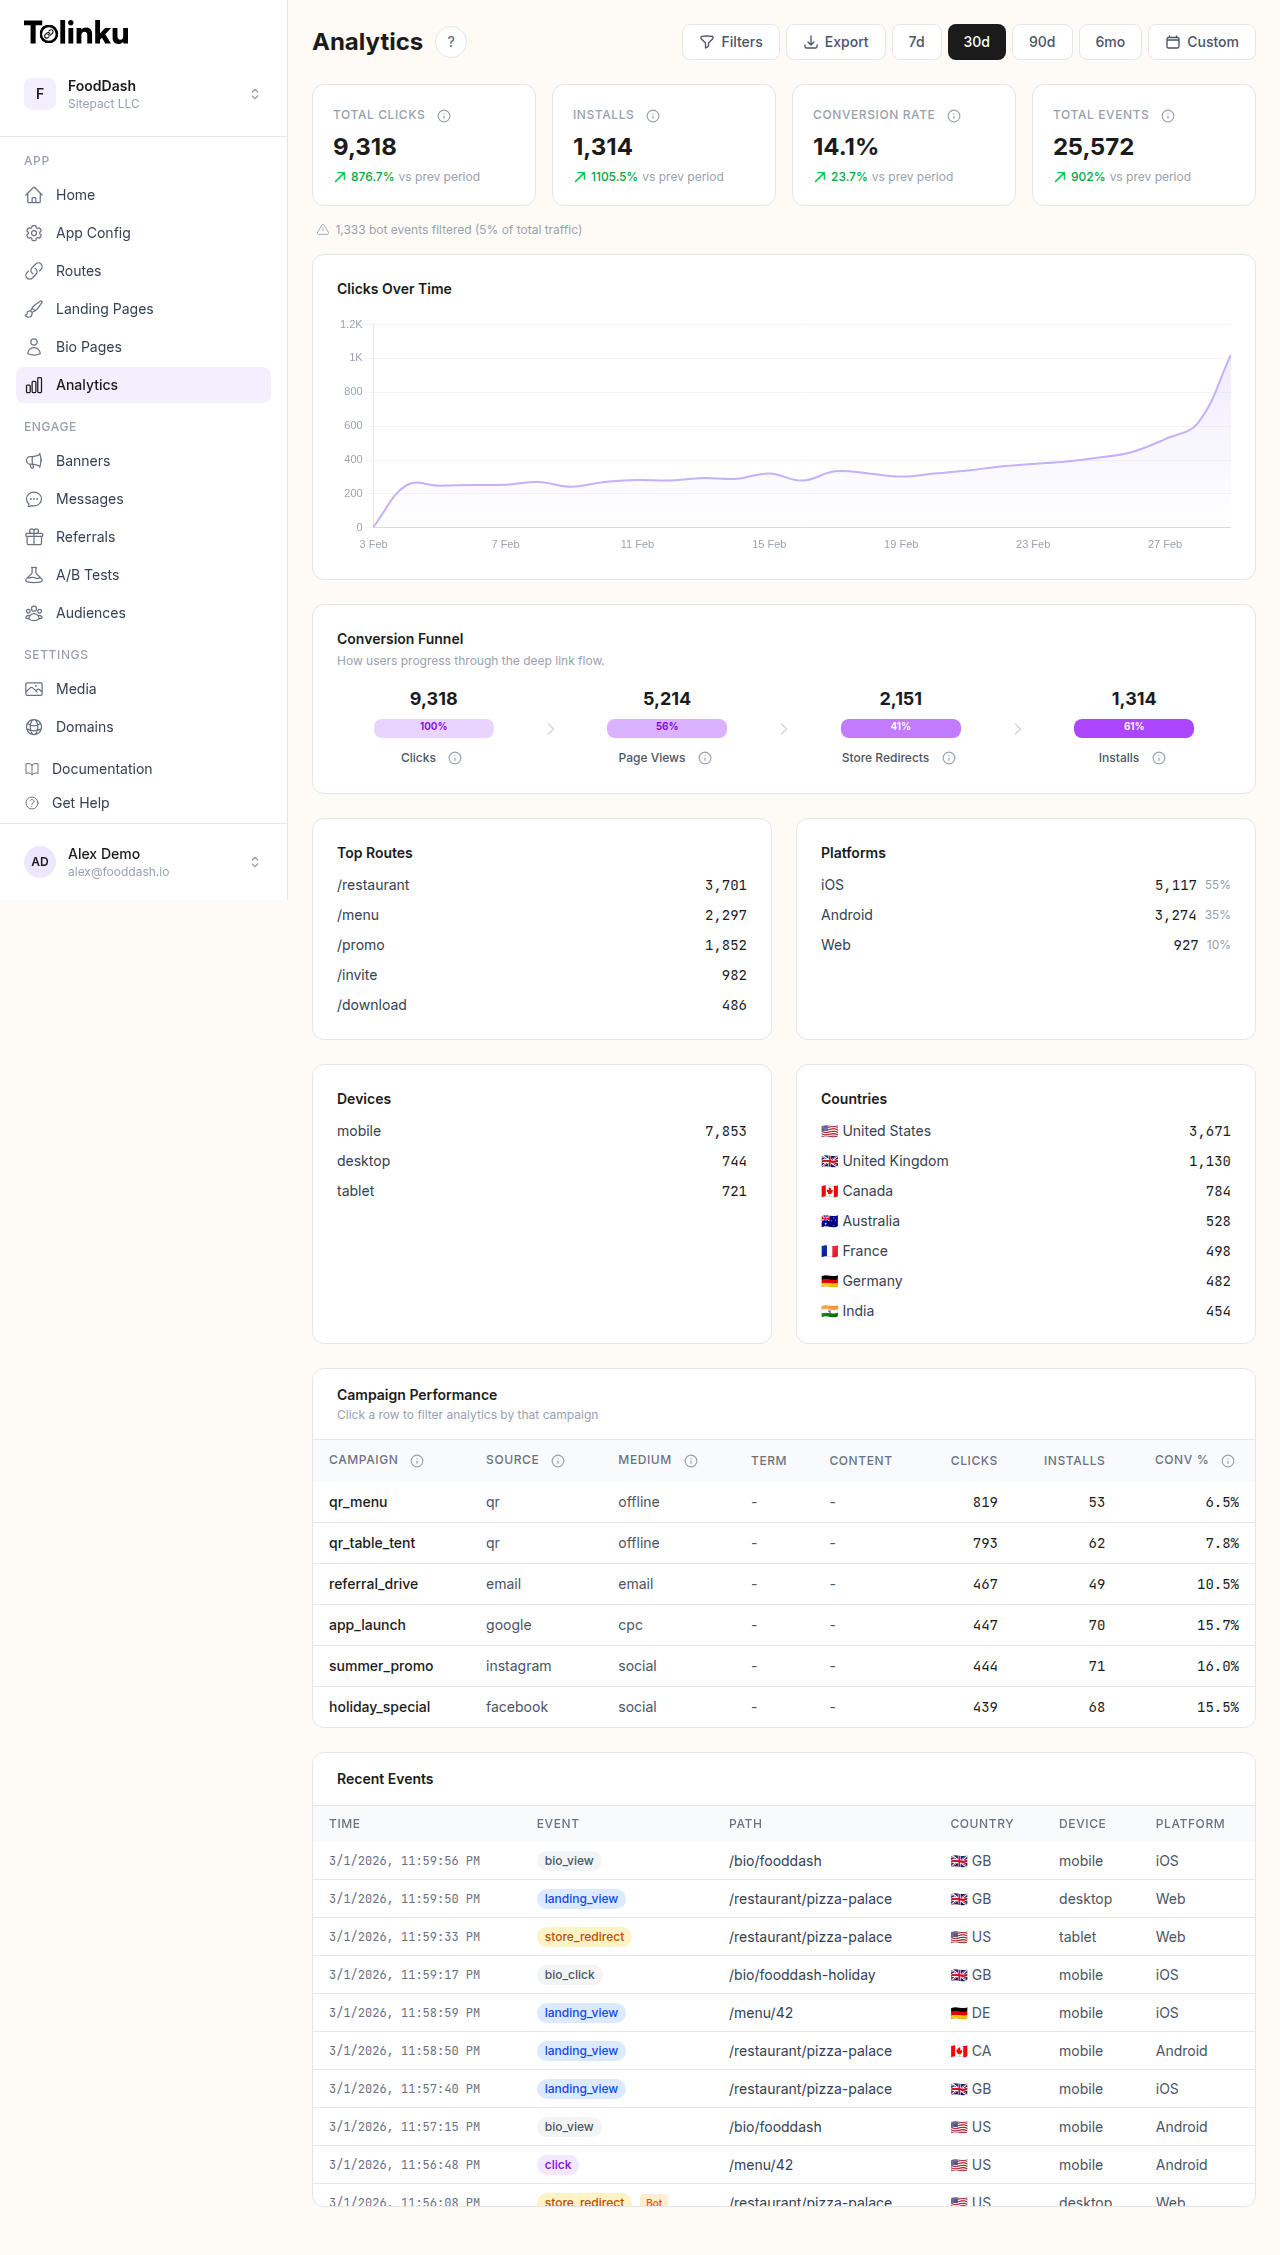 The analytics dashboard with date range selector, filters, charts, and breakdowns.
What to Alert On
Critical Alerts (Immediate Action)
These indicate something is broken:
| Alert | Condition | Severity | Typical Cause |
|---|---|---|---|
| Open rate crash | Open rate drops below 40% for 1 hour | Critical | AASA/assetlinks.json down or misconfigured |
| Error rate spike | Error rate exceeds 5% for 15 minutes | Critical | Server error, broken route |
| Zero traffic | No clicks for 30+ minutes during business hours | Critical | DNS issue, server down |
| Fallback rate spike | Fallback rate exceeds 60% for existing users | Critical | Universal Links / App Links broken |
Warning Alerts (Investigate)
These may indicate a problem developing:
| Alert | Condition | Severity | Typical Cause |
|---|---|---|---|
| Conversion drop | Conversion rate drops 30%+ vs 7-day average | Warning | Landing page issue, offer expired |
| Latency increase | Average latency exceeds 500ms for 30 minutes | Warning | Server performance degradation |
| Platform divergence | iOS and Android open rates diverge by 20%+ | Warning | Platform-specific configuration issue |
| Campaign underperformance | Campaign CTR below 50% of baseline | Warning | Poor targeting, creative fatigue |
Informational Alerts (FYI)
Track notable events:
| Alert | Condition | Severity |
|---|---|---|
| Traffic spike | Clicks exceed 200% of normal for the hour | Info |
| New country detected | Significant traffic from a country not in top 20 | Info |
| Budget threshold | Campaign spend reaches 80% of budget | Info |
Alert Architecture
Components
Data Pipeline → Aggregation → Rule Engine → Notification Router
                                               ├→ Slack
                                               ├→ Email
                                               ├→ PagerDuty
                                               └→ Webhook
Implementation
interface AlertRule {
  id: string;
  name: string;
  metric: string;
  condition: {
    type: 'threshold' | 'percentage_change' | 'anomaly';
    operator: 'above' | 'below';
    value: number;
    window: string;       // "15m", "1h", "24h"
    baseline?: string;    // "7d_average", "previous_period"
  };
  severity: 'critical' | 'warning' | 'info';
  notifications: {
    channels: string[];   // Slack channels, email addresses
    cooldown: string;     // "15m", "1h" - minimum time between alerts
  };
  filters?: {
    platform?: string;
    route?: string;
    campaign?: string;
  };
}

const alertRules: AlertRule[] = [
  {
    id: 'open-rate-crash',
    name: 'Deep Link Open Rate Crash',
    metric: 'open_rate',
    condition: {
      type: 'threshold',
      operator: 'below',
      value: 40,
      window: '1h'
    },
    severity: 'critical',
    notifications: {
      channels: ['#deep-links-critical', '[email protected]'],
      cooldown: '15m'
    }
  },
  {
    id: 'conversion-drop',
    name: 'Conversion Rate Drop',
    metric: 'conversion_rate',
    condition: {
      type: 'percentage_change',
      operator: 'below',
      value: -30,
      window: '4h',
      baseline: '7d_average'
    },
    severity: 'warning',
    notifications: {
      channels: ['#deep-links-alerts'],
      cooldown: '1h'
    }
  }
];
Evaluation Loop
async function evaluateAlerts(rules: AlertRule[]) {
  for (const rule of rules) {
    // Check cooldown
    if (isInCooldown(rule.id)) continue;

    // Get current metric value
    const currentValue = await getMetricValue(
      rule.metric,
      rule.condition.window,
      rule.filters
    );

    // Evaluate condition
    let triggered = false;

    switch (rule.condition.type) {
      case 'threshold':
        triggered = rule.condition.operator === 'below'
          ? currentValue < rule.condition.value
          : currentValue > rule.condition.value;
        break;

      case 'percentage_change':
        const baseline = await getBaselineValue(
          rule.metric,
          rule.condition.baseline || '7d_average',
          rule.filters
        );
        const change = ((currentValue - baseline) / baseline) * 100;
        triggered = rule.condition.operator === 'below'
          ? change < rule.condition.value
          : change > rule.condition.value;
        break;

      case 'anomaly':
        triggered = await isAnomaly(rule.metric, currentValue, rule.condition.window);
        break;
    }

    if (triggered) {
      await sendAlert(rule, currentValue);
      setCooldown(rule.id, rule.notifications.cooldown);
    }
  }
}
Anomaly Detection
Statistical Methods
Simple threshold alerts miss gradual degradation. Anomaly detection catches changes that are unusual relative to historical patterns.
Moving Average with Standard Deviation
function detectAnomaly(
  current: number,
  history: number[],
  sensitivity: number = 2 // standard deviations
): { isAnomaly: boolean; zScore: number; expected: number } {
  const mean = history.reduce((sum, v) => sum + v, 0) / history.length;
  const variance = history.reduce((sum, v) => sum + Math.pow(v - mean, 2), 0) / history.length;
  const stdDev = Math.sqrt(variance);

  const zScore = stdDev > 0 ? (current - mean) / stdDev : 0;

  return {
    isAnomaly: Math.abs(zScore) > sensitivity,
    zScore,
    expected: mean
  };
}

// Usage
const last7Days = await getHourlyValues('open_rate', 7);
const currentHour = await getCurrentHourValue('open_rate');
const result = detectAnomaly(currentHour, last7Days);

if (result.isAnomaly) {
  console.log(`Anomaly detected: open rate is ${currentHour}%, expected ~${result.expected}%`);
}
Seasonal Adjustment
Deep link traffic follows daily and weekly patterns. Compare the current hour to the same hour on previous days:
SELECT
  AVG(open_rate) AS expected_open_rate,
  STDDEV(open_rate) AS stddev_open_rate
FROM hourly_metrics
WHERE EXTRACT(HOUR FROM timestamp) = EXTRACT(HOUR FROM NOW())
  AND EXTRACT(DOW FROM timestamp) = EXTRACT(DOW FROM NOW())
  AND timestamp >= NOW() - INTERVAL '28 days'
  AND timestamp < NOW() - INTERVAL '1 day';
This compares Tuesday 2pm to the last 4 Tuesdays at 2pm, accounting for both daily and weekly seasonality.
Notification Channels
Slack Notifications
async function sendSlackAlert(
  webhookUrl: string,
  rule: AlertRule,
  currentValue: number
) {
  const severityEmoji = {
    critical: ':rotating_light:',
    warning: ':warning:',
    info: ':information_source:'
  };

  const message = {
    blocks: [
      {
        type: 'header',
        text: {
          type: 'plain_text',
          text: `${severityEmoji[rule.severity]} ${rule.name}`
        }
      },
      {
        type: 'section',
        fields: [
          { type: 'mrkdwn', text: `*Metric:* ${rule.metric}` },
          { type: 'mrkdwn', text: `*Current:* ${currentValue}` },
          { type: 'mrkdwn', text: `*Threshold:* ${rule.condition.operator} ${rule.condition.value}` },
          { type: 'mrkdwn', text: `*Window:* ${rule.condition.window}` }
        ]
      },
      {
        type: 'actions',
        elements: [
          {
            type: 'button',
            text: { type: 'plain_text', text: 'View Dashboard' },
            url: 'https://app.tolinku.com/analytics'
          }
        ]
      }
    ]
  };

  await fetch(webhookUrl, {
    method: 'POST',
    headers: { 'Content-Type': 'application/json' },
    body: JSON.stringify(message)
  });
}
PagerDuty Integration
For critical alerts that require immediate response:
async function sendPagerDutyAlert(
  routingKey: string,
  rule: AlertRule,
  currentValue: number
) {
  await fetch('https://events.pagerduty.com/v2/enqueue', {
    method: 'POST',
    headers: { 'Content-Type': 'application/json' },
    body: JSON.stringify({
      routing_key: routingKey,
      event_action: 'trigger',
      payload: {
        summary: `${rule.name}: ${rule.metric} is ${currentValue} (threshold: ${rule.condition.value})`,
        severity: rule.severity === 'critical' ? 'critical' : 'warning',
        source: 'deep-link-analytics',
        component: 'deep-links',
        custom_details: {
          metric: rule.metric,
          current_value: currentValue,
          threshold: rule.condition.value,
          window: rule.condition.window
        }
      }
    })
  });
}
Alert Best Practices
Avoid Alert Fatigue
Too many alerts cause people to ignore all of them:
| Problem | Solution |
|---|---|
| Too many low-priority alerts | Batch informational alerts into a daily digest |
| Flapping (alert triggers and resolves repeatedly) | Add hysteresis: trigger at 40%, resolve at 50% |
| Duplicate alerts for the same issue | Group related alerts, suppress duplicates within cooldown |
| Alerts during maintenance | Implement maintenance windows that suppress alerts |
Runbook for Each Alert
Every alert should link to a runbook explaining what to do:
## Alert: Deep Link Open Rate Crash

**What it means:** The percentage of deep link clicks that successfully
open the app has dropped below 40%.

**Common causes:**
1. AASA file (iOS) is returning a non-200 status or incorrect content-type
2. assetlinks.json (Android) verification is failing
3. App was removed from an app store
4. CDN is caching a stale or error response for verification files

**Investigation steps:**
1. Check AASA: `curl -I https://yourdomain.com/.well-known/apple-app-site-association`
2. Check assetlinks: `curl -I https://yourdomain.com/.well-known/assetlinks.json`
3. Check platform breakdown: Is it iOS-only, Android-only, or both?
4. Check if the issue started at a specific time (deployment, DNS change?)

**Resolution:**
- Fix the verification file and ensure it returns 200 with correct headers
- Purge CDN cache for the verification file
- Verify with Apple's and Google's validation tools
Tolinku for Alert Configuration
Tolinku's webhooks can push deep link events to your alert infrastructure. Combined with Tolinku's analytics, you can monitor open rates, fallback rates, and error rates from the Tolinku dashboard and set up external alerting via webhook integrations.
For real-time monitoring, see real-time analytics dashboards for deep links. For analytics fundamentals, see deep link analytics: measuring what matters.
Get deep linking tips in your inbox
One email per week. No spam.