Every short link you create is a data collection opportunity. Each click captures who clicked, where they are, what device they used, and when the click happened. The question is whether your link management setup actually surfaces this data in a useful way.
This guide covers what click data you should be tracking, how to set up real-time analytics for your short links, and how to use that data to optimize your campaigns.
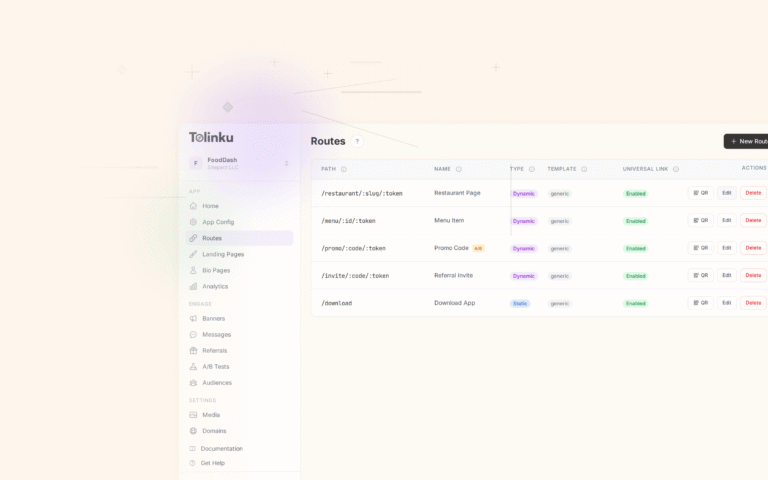
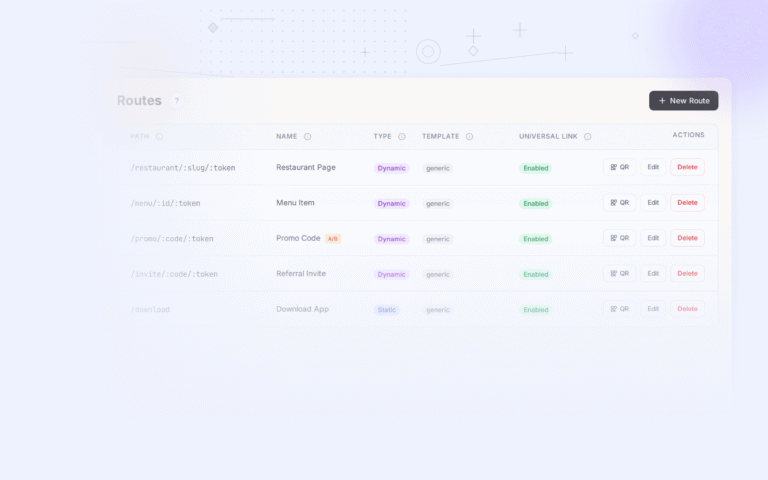
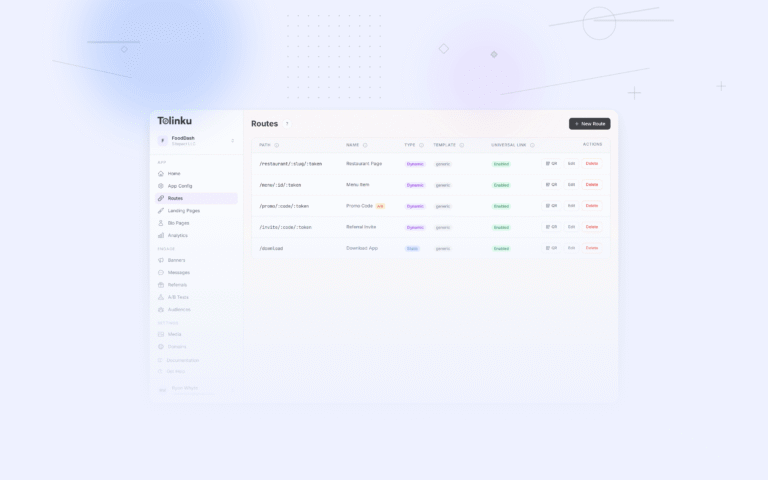
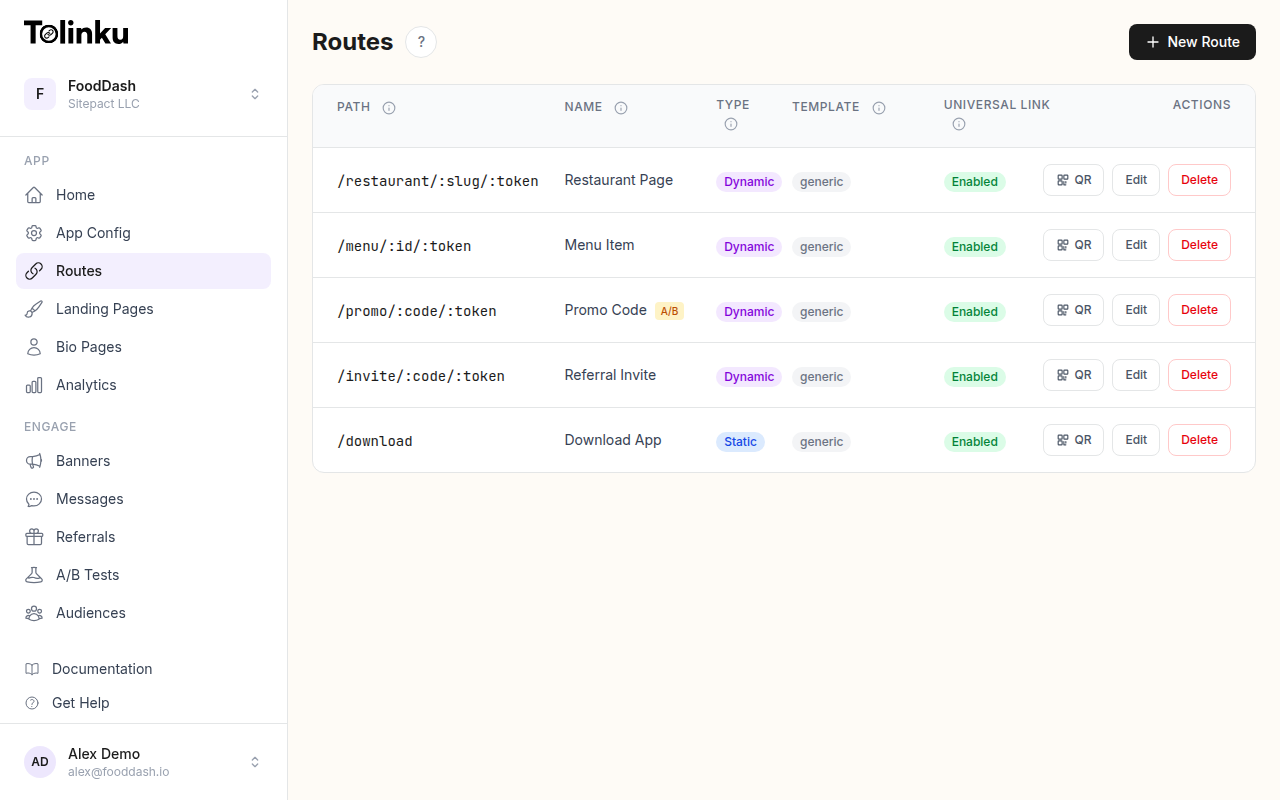 Tolinku route configuration with QR code generation for each deep link.
What Gets Tracked on Every Click
When someone clicks a short link, the redirect server processes the request before sending the user to the destination. During that processing window (typically a few milliseconds), the server captures:
Device and Platform Data
- Operating system: iOS, Android, Windows, macOS, Linux
- Device type: Mobile phone, tablet, desktop computer
- Browser: Chrome, Safari, Firefox, in-app browsers (Instagram, Facebook, Twitter)
- Screen resolution: Useful for understanding device segments
This data tells you where your audience lives digitally. If 70% of your clicks come from iOS, your iOS app experience should be your top priority.
Geographic Data
- Country: Derived from IP geolocation
- Region/State: More granular location data
- City: Available in most cases, though accuracy varies
Geographic data reveals which markets engage most with your content. It's especially valuable for businesses operating in multiple regions, helping you understand where demand is strongest.
Timing Data
- Timestamp: Exact time of each click (UTC)
- Day of week patterns: When your audience is most active
- Time of day patterns: Peak engagement hours
Timing data helps you optimize when to send campaigns. If most of your clicks happen between 8-10 AM on weekdays, that's when your audience is paying attention.
Referrer Information
- Referrer URL: Which website or app the user clicked from
- UTM parameters: Campaign, source, medium, and content tags
- Direct vs. referred: Whether the user typed the URL or clicked from somewhere
Referrer data connects clicks to channels. You can see whether Twitter, email, or a partner website drove each click.
Setting Up Click Tracking
With Tolinku, click tracking is automatic. Every route you create tracks clicks by default, with no additional configuration needed.
Per-Link Analytics
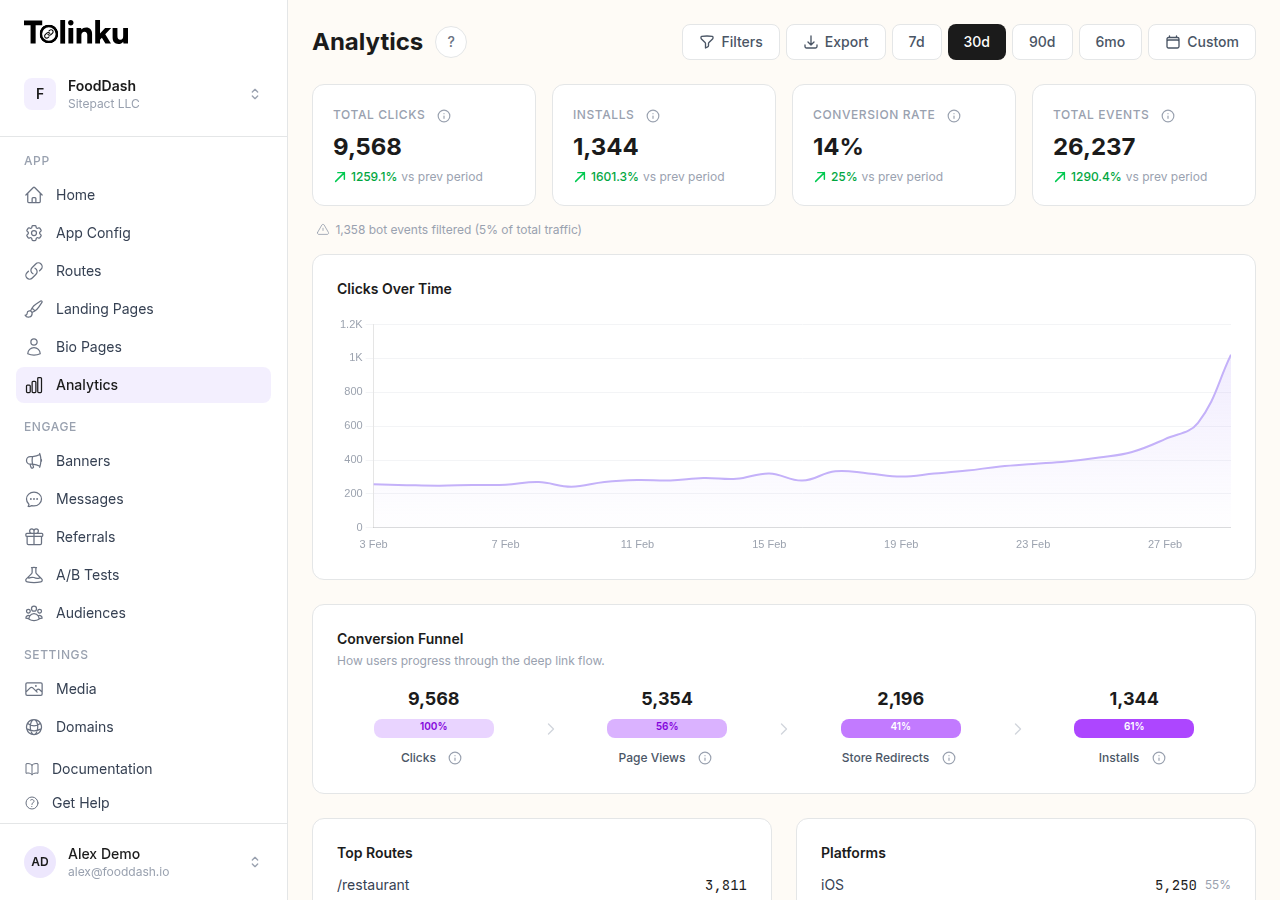
Each short link (route) has its own analytics. Navigate to the analytics dashboard and filter by route to see:
- Click volume over time (with configurable date ranges)
- Platform and device breakdown
- Geographic distribution
- Top referrers
Campaign-Level Tracking
For campaigns with multiple links, use analytics filtering to compare performance across routes. Create separate routes for each channel or creative variant:
go.app.com/promo-email     → Email newsletter clicks
go.app.com/promo-twitter   → Twitter post clicks
go.app.com/promo-instagram → Instagram bio link clicks
go.app.com/promo-qr        → QR code scans from print
Each route tracks independently, giving you a clear view of which channels perform best.
Real-Time Webhooks
For programmatic access to click data, webhooks deliver events to your backend as they happen. Each click triggers a link.clicked event:
{
  "event": "link.clicked",
  "data": {
    "prefix": "promo",
    "token": "summer-sale",
    "platform": "ios",
    "device_type": "mobile",
    "hostname": "go.yourapp.com",
    "ip": "203.0.113.42",
    "campaign": "summer_2026"
  }
}
This enables real-time dashboards, automated alerts, and integration with your data warehouse. See Webhook Event Types for the complete payload schema.
Key Metrics to Monitor
Click Volume
The most basic metric, but context matters. Track:
- Total clicks: Raw engagement count
- Unique clicks: Deduplicated by device/IP to approximate unique users
- Click velocity: Rate of clicks per hour or per day (useful for detecting spikes or anomalies)
Click-Through Rate (CTR)
If you know how many people saw your link (email opens, social impressions, print distribution), CTR connects impressions to engagement:
CTR = clicks / impressions × 100
CTR benchmarks vary wildly by channel:
| Channel | Typical CTR |
|---|---|
| Email (dedicated link) | 2-5% |
| Social media (organic) | 0.5-2% |
| SMS | 10-20% |
| QR code (packaging) | 2-5% |
| QR code (restaurant table) | 15-40% |
Geographic Concentration
Analyze where your clicks come from to understand market penetration. A high click concentration in one region might indicate:
- Strong brand awareness in that market
- Effective localized marketing
- Or simply that your content was shared heavily in one community
Device Split
Track the iOS/Android/desktop split over time. Shifts in device distribution can indicate:
- A new audience segment discovering your content
- Platform-specific issues (if one platform drops suddenly)
- The need to prioritize one platform's user experience
Using Click Data for Optimization
A/B Testing Link Creatives
Create two versions of the same campaign with different messaging or landing pages. Give each a separate short link and compare CTR:
go.app.com/summer-v1  → Landing page A (lifestyle imagery)
go.app.com/summer-v2  → Landing page B (product-focused)
After collecting enough data (typically a few hundred clicks per variant), the click data tells you which creative performs better.
Tolinku also offers built-in A/B testing for deeper experimentation with statistical significance calculations.
Channel Optimization
Compare click data across channels to allocate marketing spend:
- Create channel-specific short links (one per platform/channel)
- Track clicks and downstream conversions for each
- Calculate cost per click and cost per conversion by channel
- Shift budget toward the highest-performing channels
Timing Optimization
Use time-of-day and day-of-week click patterns to optimize send times:
- If email links get the most clicks between 9-11 AM, schedule sends for 8:45 AM
- If social media links peak on Tuesday and Thursday, focus your posting schedule there
- If QR code scans spike at lunchtime, that's when your in-store promotions are working
Geographic Targeting
Click data reveals your strongest markets. Use this to:
- Prioritize localization efforts for high-engagement regions
- Create region-specific campaigns for underperforming areas
- Adjust ad spend geographically based on actual engagement data
Data Export and Integration
For analysis beyond the dashboard, export your analytics data as CSV. This enables:
- Custom reporting in spreadsheet tools or BI platforms
- Joining click data with sales data from your CRM or POS
- Building predictive models based on historical click patterns
- Automated reporting pipelines for stakeholders
For real-time integration, webhooks feed click events directly into tools like:
- Data warehouses: BigQuery, Snowflake, Redshift
- Analytics platforms: Amplitude, Mixpanel, Segment
- CRM systems: Salesforce, HubSpot
- Custom dashboards: Grafana, Metabase
Privacy Considerations
Click tracking involves collecting user data, which means privacy regulations apply.
IP-based geolocation: IP addresses are personal data under GDPR and similar laws. Ensure your privacy policy discloses that you collect geographic data from link clicks. Consider whether you need to anonymize or aggregate this data.
Cookie-less tracking: Short link click tracking is typically cookie-less (the redirect doesn't set cookies), which means it's less intrusive than web analytics tools that track across sessions. Each click is an independent event.
Data retention: Define how long you keep click data. Many platforms allow you to configure retention periods. Only keep data as long as it's analytically useful.
For a broader look at link analytics, see Deep Link Analytics: Measuring What Matters and QR Code Analytics: Tracking Scans and Conversions.
For more on short links in mobile marketing, see QR Codes and Short Links for Mobile Apps.
Get deep linking tips in your inbox
One email per week. No spam.