Most A/B tests die in the analytics phase. Teams run experiments correctly, collect enough data, and then stare at dashboards without knowing what to do next. The problem is rarely bad data. It is the gap between reading numbers and making decisions.
This guide covers how to read A/B test analytics for deep link campaigns, segment your results for deeper insight, and turn data into concrete next steps. For test design fundamentals, see A/B Testing Deep Links and Landing Pages. For measurement methodology, see Measuring A/B Test Results for Deep Link Campaigns.
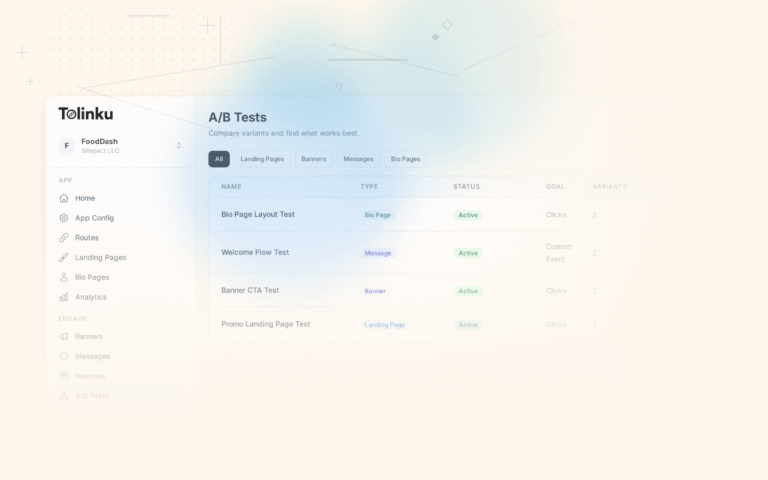
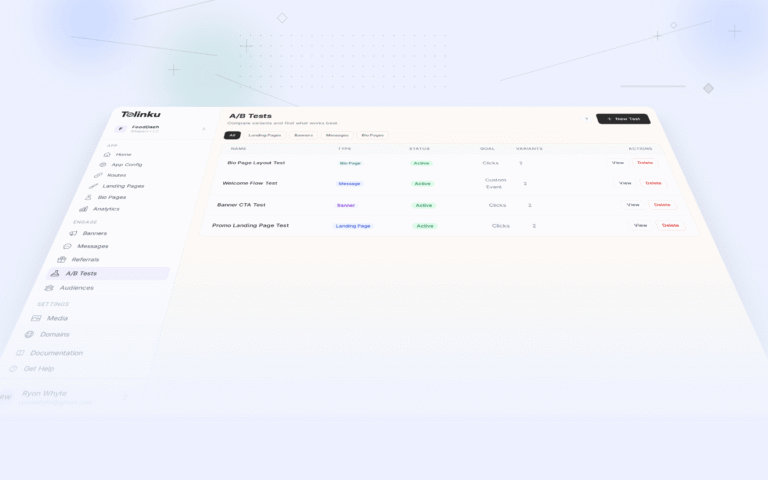
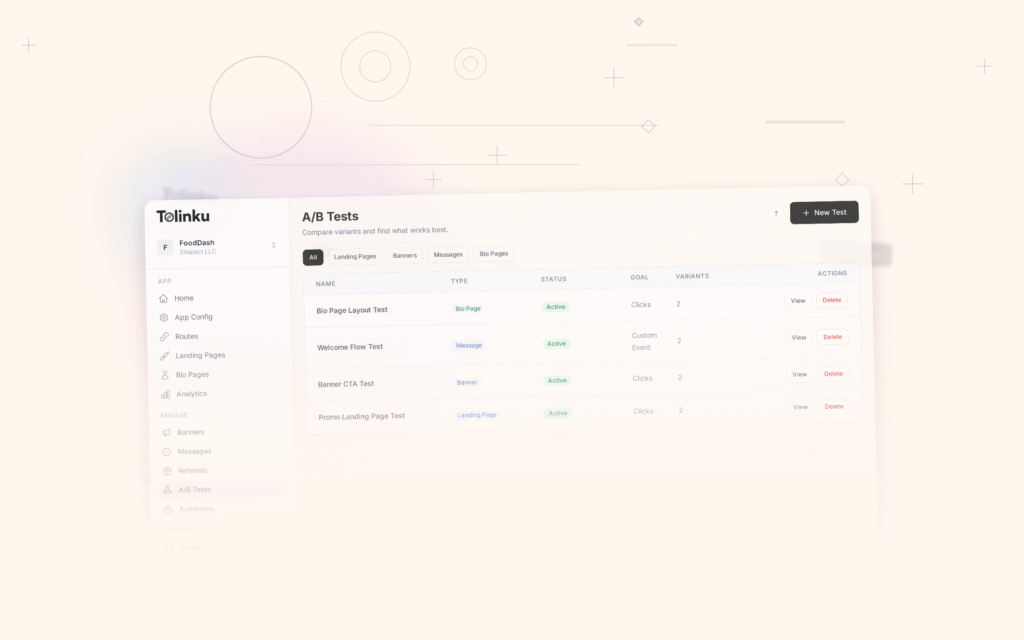
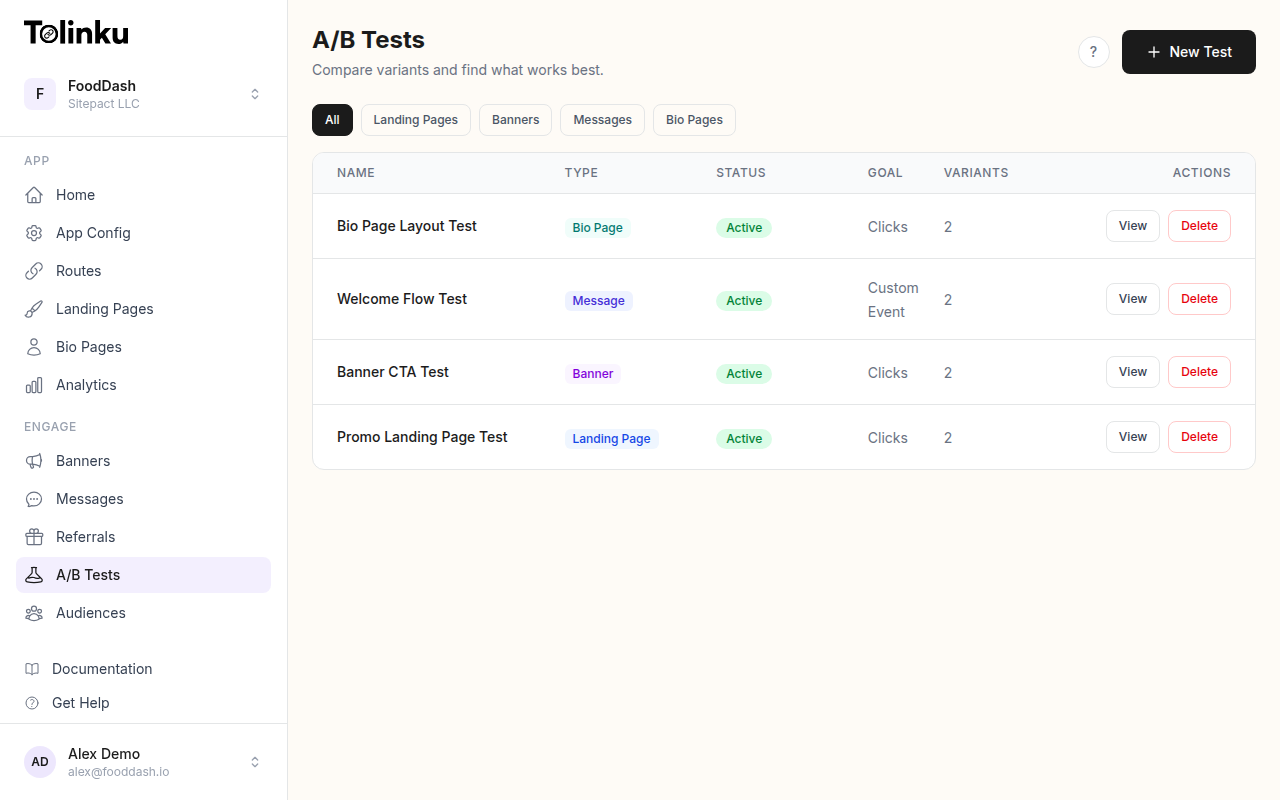 The A/B tests list page showing test names, status, types, and variant counts.
Key Metrics for Deep Link A/B Tests
Before diving into dashboards, you need to know which numbers matter. Every deep link experiment maps to a small set of metrics that tell the full story.
Primary Metrics by Test Type
| Test Type | Primary Metric | What It Tells You |
|---|---|---|
| Link preview/OG tags | Click-through rate (CTR) | Are users compelled to tap the link? |
| Fallback/landing page | Install rate | Does the page convert visitors to installs? |
| Onboarding flow | Activation rate | Do new users complete key actions? |
| CTA copy or placement | Conversion rate | Does the user take the intended action? |
| Referral link variants | Referral conversion rate | Do recipients accept the referral? |
| Monetization paths | Revenue per user (RPU) | Does the variant generate more revenue? |
Pick one primary metric before the test starts. Measuring everything equally means you are measuring nothing. Secondary metrics (2-3 guardrails) exist to catch unintended side effects, not to determine the winner.
The Metrics That Matter Most
For most deep link experiments, these four metrics cover the full funnel:
Click-through rate (CTR): Clicks divided by impressions. Measures top-of-funnel interest. Useful for link preview tests, banner tests, and CTA experiments.
Install rate: Installs divided by link clicks. Measures how well your fallback page or app store listing converts. Critical for campaigns targeting new users.
Conversion rate: Goal completions divided by total users in the variant. The definition of "conversion" depends on your test (signup, purchase, share, etc.).
Revenue per user (RPU): Total revenue divided by users in the variant. The ultimate downstream metric. Use this when testing experiences that affect monetization.
Reading Your Results Dashboard
Tolinku's analytics dashboard presents A/B test data with variant-level breakdowns. Here is how to read it effectively.
Start with the Summary
Look at the top-level comparison first. A summary view typically shows each variant side by side with the primary metric, sample size, and confidence level. Before digging deeper, ask three questions:
- Is the sample size large enough? (See Statistical Significance for A/B Tests for guidance.)
- Is there a clear winner, or are the variants within the margin of error?
- Has the test run long enough to capture weekly cycles (at least 7 days)?
Read the Trend, Not Just the Number
A single summary number hides important patterns. Always check the time-series chart. A healthy test shows stable, converging metrics after an initial fluctuation period. Watch for these red flags:
- Diverging trends: If the gap between variants is growing over time, the test may not have reached equilibrium. External factors (a marketing campaign, a seasonal spike) could be influencing one variant more than the other.
- Sudden jumps: A sharp change in one variant's performance mid-test often signals a confounding event. Investigate before drawing conclusions.
- Flat lines with low volume: If both variants show identical flat performance, your sample may be too small or your variants too similar to produce a measurable difference.
Segmenting Results for Deeper Insight
Aggregate results tell you what happened. Segments tell you why. Breaking down A/B test analytics by key dimensions reveals whether a variant performs universally well or only wins in specific contexts.
Essential Segments
Segment Why It Matters Example Insight Device (iOS vs. Android) Deep link behavior differs across platforms Variant B wins on iOS but loses on Android Traffic source (social, email, paid, organic) User intent varies by channel Email users prefer variant A; social users prefer B Time of day / day of week User behavior shifts by timing Variant B only outperforms during weekday mornings New vs. returning users Experience level changes behavior New users convert better with variant A's simpler flow Geography Cultural and network differences Variant B performs worse in regions with slow connections When Segments Contradict the Aggregate
If variant B wins overall but loses in your highest-value segment, you have a decision to make. The aggregate winner is not always the right choice. Consider the business impact of each segment rather than just the total numbers.
For example, if 70% of your revenue comes from iOS users and variant A wins on iOS by 15% while variant B wins on Android by 5%, the revenue-weighted decision favors variant A.
Code Example: Segment Analysis
Here is a practical example of analyzing A/B test results by segment using JavaScript:
// Analyze A/B test results by device segment
function analyzeBySegment(events, segmentKey) {
  const segments = {};

  for (const event of events) {
    const segment = event[segmentKey]; // e.g., "ios", "android"
    const variant = event.variant;     // e.g., "A", "B"

    if (!segments[segment]) {
      segments[segment] = {};
    }
    if (!segments[segment][variant]) {
      segments[segment][variant] = { clicks: 0, conversions: 0 };
    }

    segments[segment][variant].clicks += 1;
    if (event.converted) {
      segments[segment][variant].conversions += 1;
    }
  }

  // Calculate conversion rates per segment per variant
  const results = {};
  for (const [segment, variants] of Object.entries(segments)) {
    results[segment] = {};
    for (const [variant, data] of Object.entries(variants)) {
      results[segment][variant] = {
        conversionRate: (data.conversions / data.clicks) * 100,
        sampleSize: data.clicks,
        conversions: data.conversions,
      };
    }
  }

  return results;
}

// Usage
const segmentResults = analyzeBySegment(testEvents, 'platform');
console.log(segmentResults);
// Output:
// {
//   ios: { A: { conversionRate: 4.2, sampleSize: 3200 }, B: { conversionRate: 5.1, sampleSize: 3150 } },
//   android: { A: { conversionRate: 3.8, sampleSize: 2800 }, B: { conversionRate: 3.6, sampleSize: 2750 } }
// }
Code Example: Confidence Interval Check
Before acting on results, verify the observed difference is statistically meaningful:
// Check if a result is statistically significant using a z-test
function isSignificant(controlRate, variantRate, controlSize, variantSize, alpha = 0.05) {
  const pooledRate = (controlRate * controlSize + variantRate * variantSize) /
                     (controlSize + variantSize);
  const standardError = Math.sqrt(
    pooledRate * (1 - pooledRate) * (1 / controlSize + 1 / variantSize)
  );

  if (standardError === 0) return false;

  const zScore = (variantRate - controlRate) / standardError;
  const zCritical = 1.96; // 95% confidence

  return Math.abs(zScore) > zCritical;
}

// Example: Is variant B's 5.1% conversion rate significantly
// better than variant A's 4.2%?
const significant = isSignificant(0.042, 0.051, 3200, 3150);
console.log(significant); // true or false
When Results Are Actionable vs. When You Need More Data
Not every result is ready for a decision. Here is how to categorize what you are seeing.
Actionable Results
- Clear winner with statistical significance: The primary metric shows a meaningful difference at 95% confidence or higher, and the result is consistent across key segments.
- Clear loser: One variant is obviously worse (large negative effect, consistent across segments). Kill it early to stop wasting traffic.
- No difference after adequate sample size: If you have run the test to full sample size and neither variant wins, the difference is too small to matter. Pick whichever is simpler to maintain.
Results That Need More Data
- Promising trend but below significance threshold: The variant looks better, but confidence is only at 80-90%. Keep running the test. Do not peek and declare a winner.
- Mixed segment results: One variant wins in some segments and loses in others. Collect more data to see if the segment-level differences are statistically significant, not just directional.
- High variance in daily performance: The metrics swing wildly from day to day. This usually means low traffic volume. Extend the test duration.
Turning Results into Decisions
The Decision Framework
Once you have a statistically significant result, map it to one of three actions:
Outcome Action Next Step Variant wins by a meaningful margin Implement the winner Roll out to 100% of traffic Variant wins, but the effect is small Iterate Design a bolder variation and test again Neither variant wins Kill the test Document the null result and move on Variant wins in some segments only Personalize or iterate Consider segment-specific experiences Rolling Out the Winner
When you have a winner, Tolinku's A/B testing feature lets you shift traffic allocation to the winning variant. A phased rollout (50/50 to 75/25 to 100/0) is safer than flipping a switch, especially for high-traffic routes.
During rollout, continue monitoring:
- The primary metric (does it hold at full traffic?)
- Error rates and latency (operational health)
- Secondary metrics (no new regressions)
If the winning variant's performance degrades at full traffic, investigate. Selection effects during a 50/50 test can sometimes mask issues that appear at 100%.
Documenting Learnings
Every completed test, whether it produced a winner or not, should generate a brief record:
- Hypothesis: What you expected to happen and why.
- Result: What actually happened (primary metric, sample size, confidence level).
- Segments: Any notable segment-level differences.
- Decision: What you did with the result.
- Follow-up: What you plan to test next based on this learning.
This log becomes invaluable over time. It prevents teams from re-testing ideas that already failed and builds institutional knowledge about what moves the needle.
Planning the Next Test
Good A/B testing is iterative. Each result generates hypotheses for the next experiment. If variant B's simplified landing page increased installs by 12%, your next test might simplify the onboarding flow to see if the pattern holds downstream.
Review your Tolinku A/B testing results regularly to identify patterns across multiple tests.
Common Analytics Pitfalls
1. Peeking at Results Too Early
Checking results daily and stopping when one variant "looks good" inflates your false positive rate dramatically. A result that appears significant at day 3 may vanish by day 10. Commit to a sample size before the test starts and wait.
2. Ignoring Segment Differences
An overall winner that performs poorly in your most valuable segment is not really a winner. Always check device, source, and user type breakdowns before making a decision.
3. Optimizing for the Wrong Metric
A 30% CTR improvement means nothing if those extra clicks do not convert. Make sure your primary metric is close to the behavior you care about, and use secondary metrics to verify downstream impact.
4. Survivorship Bias in Funnel Metrics
If you measure conversion rate as "purchases among users who reached the checkout page," you are excluding everyone who dropped off before checkout. Variant B might look better at checkout but be driving fewer people there. Always measure from the point of randomization (the link click), not from a downstream step.
5. Novelty Effects
A new design variant often performs well initially because it is new, not because it is better. Run tests for at least two full weeks to let the novelty effect decay before declaring a winner.
6. Multiple Testing Without Correction
Running five tests simultaneously and declaring winners at p < 0.05 each means you have roughly a 23% chance of at least one false positive. If you run many concurrent tests, use a stricter significance threshold (Bonferroni correction) or a false discovery rate method.
Best Practices Checklist
- Define one primary metric and 2-3 guardrail metrics before launching the test.
- Set your required sample size and test duration in advance (do not peek and stop early).
- Check segment-level results for device, source, and user type before declaring a winner.
- Verify statistical significance at 95% confidence before acting on results.
- Roll out winners gradually, monitoring for performance degradation at full traffic.
- Document every test result, including null results.
- Use each test's learnings to generate hypotheses for the next experiment.
- Review past test logs before designing new experiments to avoid re-testing failed ideas.
Next Steps
A/B test analytics is only valuable if it leads to action. Start by defining clear metrics for your next deep link experiment, build the habit of checking segments before declaring winners, and always document what you learn.
For a comprehensive overview of designing deep link experiments, read A/B Testing Deep Links and Landing Pages. To understand the statistical foundations behind your results, see Statistical Significance for A/B Tests: What It Means.
Ready to run your first experiment? Tolinku's A/B testing tools and built-in analytics make it straightforward to set up tests, segment results, and roll out winners across your deep link routes.
Get deep linking tips in your inbox
One email per week. No spam.