Is a 12% deep link conversion rate good? It depends on your industry, channel, and what you are measuring. E-commerce deep links to product pages might convert at 8-15%, while fintech deep links to pre-approved offers can reach 20-30%. This guide provides benchmark data to help you evaluate your deep link performance.
This guide covers deep link benchmarks by industry. For click-through rate optimization, see click-through rate optimization for deep links. For deferred deep linking conversion rates, see deferred deep linking conversion rates.
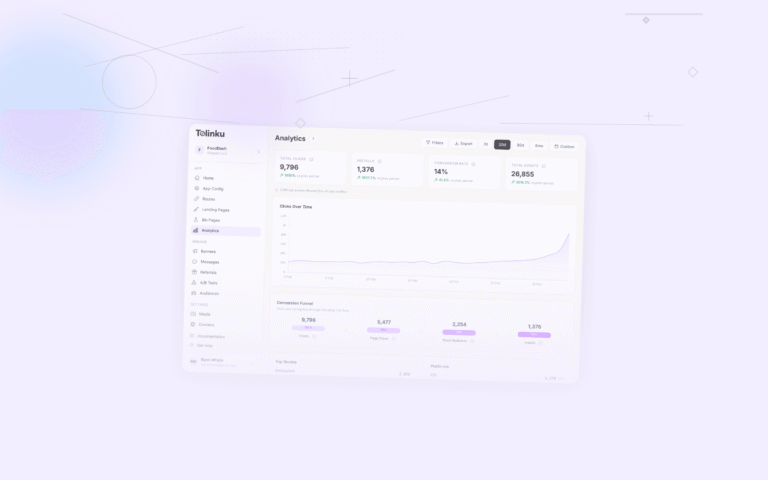
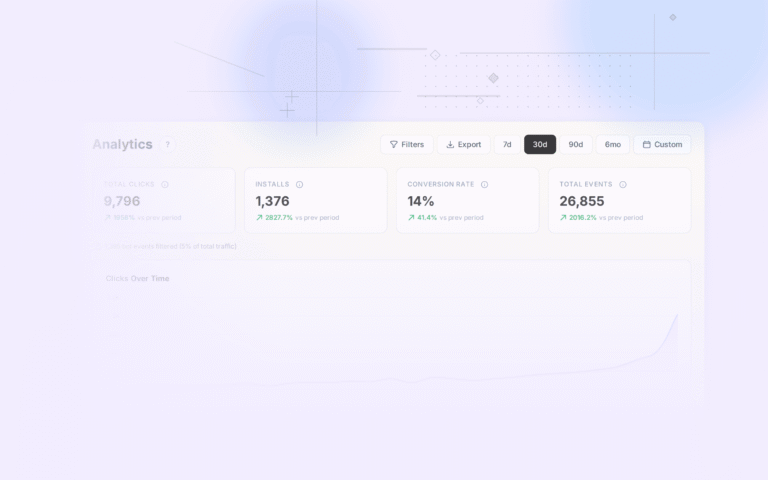
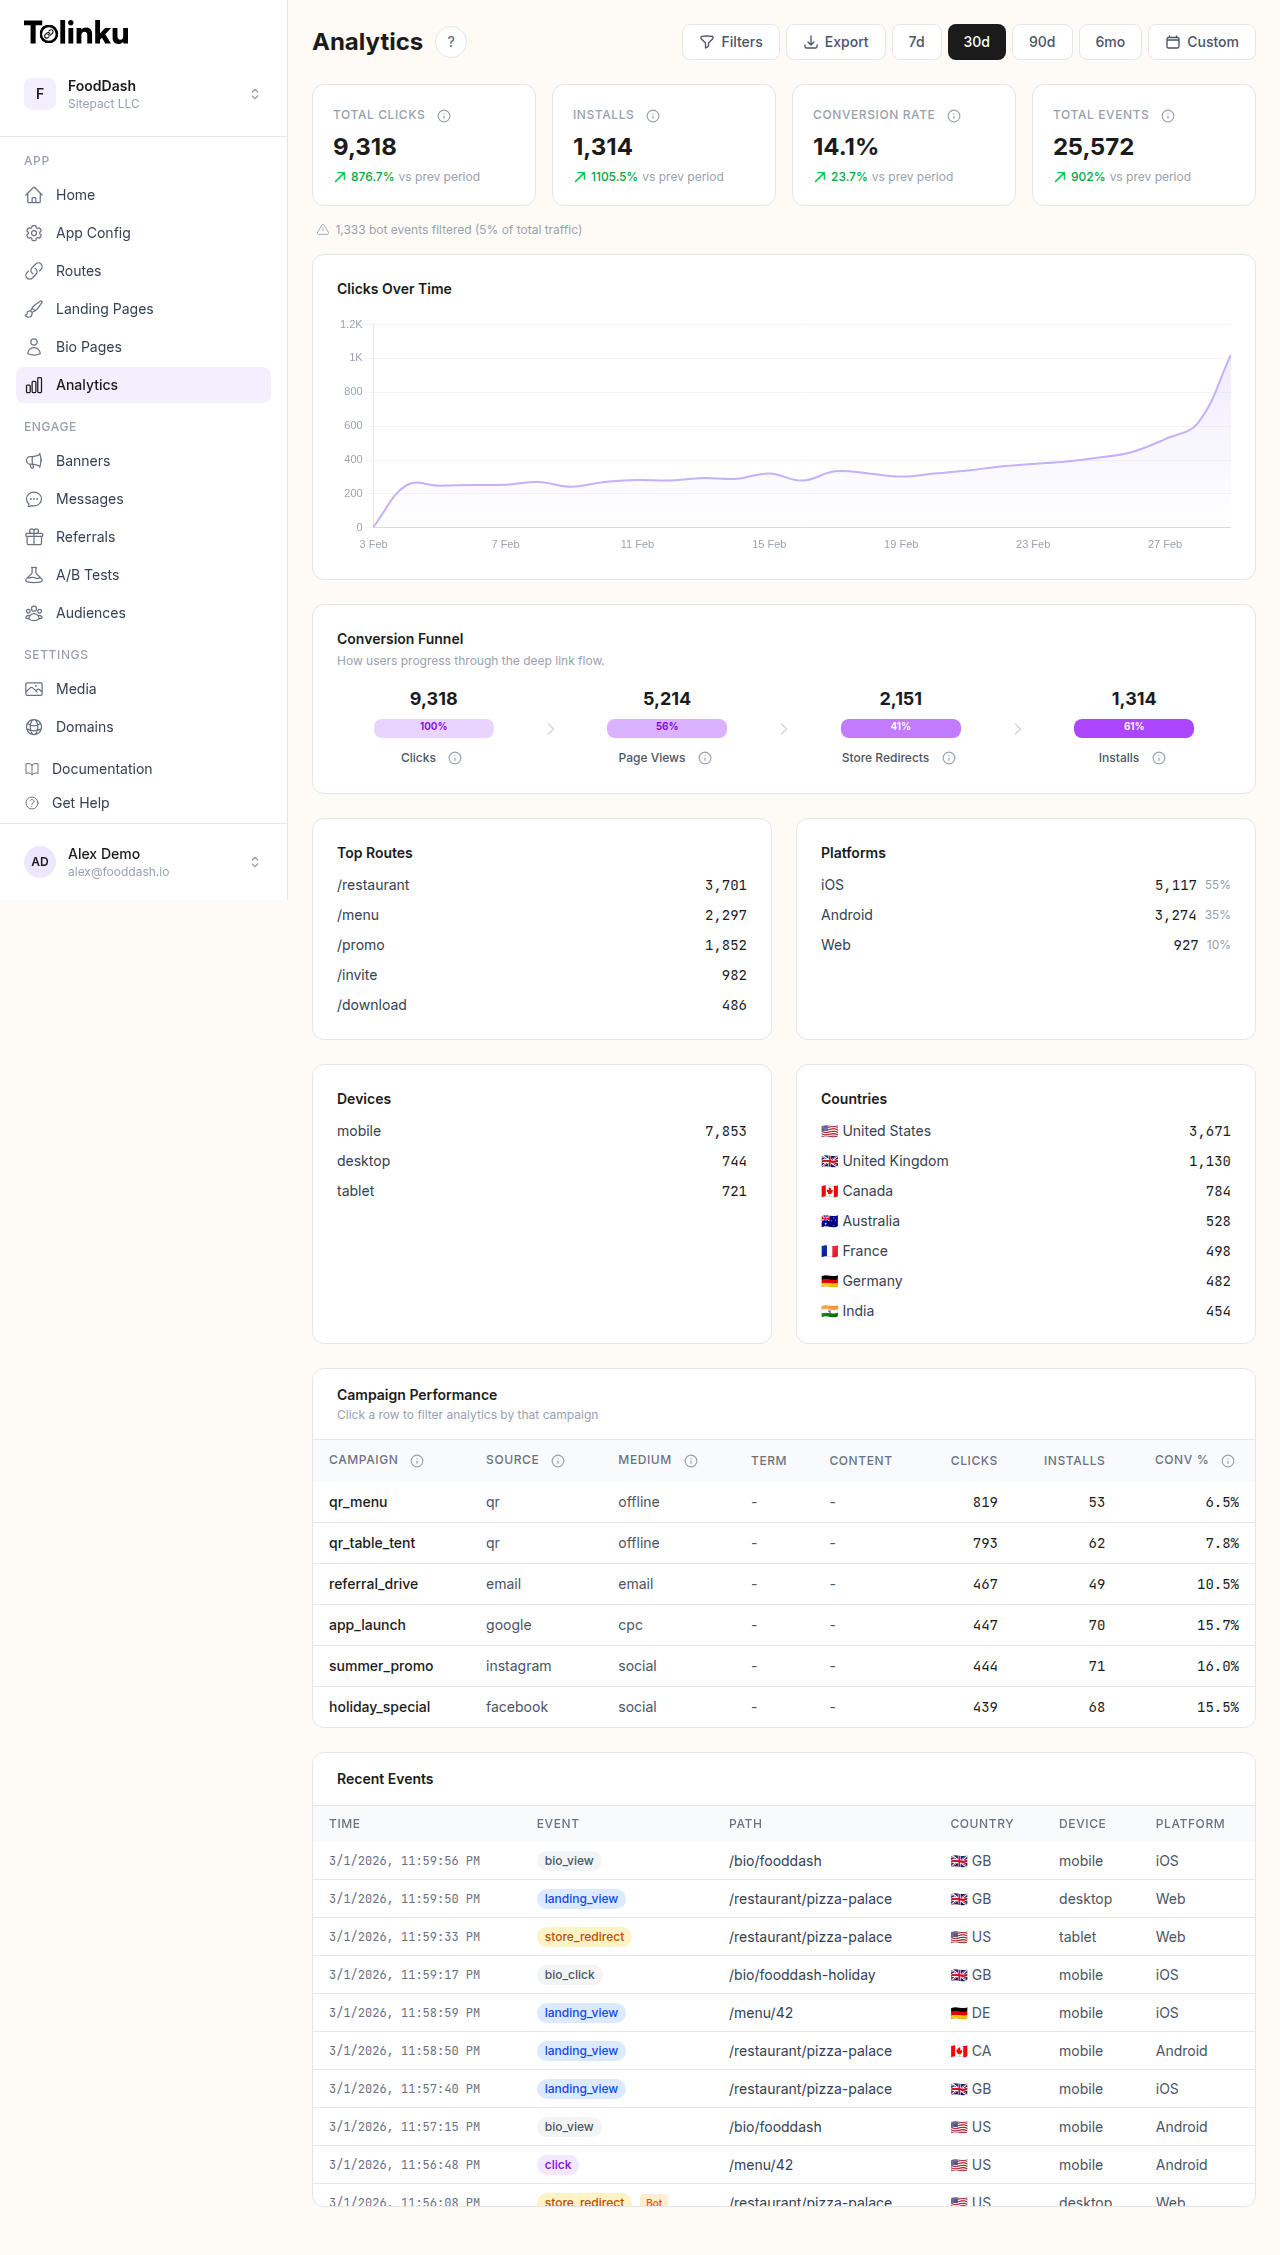 The analytics dashboard with date range selector, filters, charts, and breakdowns.
Overall Deep Link Benchmarks
App Open Rate
The percentage of deep link clicks that successfully open the app:
| Source | App Open Rate | Notes |
|---|---|---|
| Push notification | 85-95% | User already has the app |
| Email (existing users) | 60-75% | Depends on email client |
| SMS | 70-85% | Direct link, no in-app browser |
| Social media | 30-50% | In-app browser interference |
| QR code | 55-70% | Mix of app users and non-users |
| Paid ad | 40-60% | Mix of new and existing users |
| Website (smart banner) | 50-65% | User browsing mobile web |
Push notifications have the highest open rate because the user already has the app installed. Social media has the lowest because in-app browsers (Facebook, Instagram) block or interfere with Universal Links.
Fallback Rate
The percentage of clicks that land on the web fallback instead of the app:
| User Type | Expected Fallback Rate |
|---|---|
| Existing users (push, in-app) | 2-5% |
| Known users (email, SMS) | 15-25% |
| Mixed audience (social, QR) | 30-50% |
| New users (paid ads) | 50-70% |
A fallback rate above 30% for known users suggests Universal Link or App Link configuration issues.
Benchmarks by Industry
E-Commerce
| Metric | Benchmark Range | Top Performers |
|---|---|---|
| Deep link CTR (email) | 3-8% | 10-15% |
| App open rate | 65-75% | 80%+ |
| Product page conversion | 8-15% | 20%+ |
| Cart recovery conversion | 15-25% | 30%+ |
| Average order value (deep-linked) | 10-20% higher than non-deep-linked | 30%+ higher |
Cart recovery deep links consistently outperform generic re-engagement because they take the user directly to their abandoned cart with items still present.
Fintech/Banking
| Metric | Benchmark Range | Top Performers |
|---|---|---|
| Deep link CTR (email) | 2-5% | 8-12% |
| App open rate | 70-80% | 85%+ |
| Offer conversion | 10-20% | 25-30% |
| Application completion (from deep link) | 30-45% | 55%+ |
| Transaction deep link engagement | 60-75% | 85%+ |
Fintech apps have higher app open rates because users check their banking apps frequently. Transaction notification deep links have the highest engagement because users want to verify the transaction.
Gaming
| Metric | Benchmark Range | Top Performers |
|---|---|---|
| Deep link CTR (push) | 8-15% | 20%+ |
| Re-engagement rate | 15-25% | 35%+ |
| Session length (deep-linked vs organic) | 20-40% longer | 50%+ longer |
| IAP conversion (deep-linked event) | 5-10% | 15%+ |
Gaming deep links that open specific in-game content (events, challenges, social features) drive longer sessions than generic "come back and play" links.
Media/News
| Metric | Benchmark Range | Top Performers |
|---|---|---|
| Article deep link CTR | 5-12% | 18%+ |
| App open rate | 55-65% | 75%+ |
| Read completion (deep-linked article) | 40-55% | 65%+ |
| Subscription conversion | 1-3% | 5%+ |
Travel/Hospitality
| Metric | Benchmark Range | Top Performers |
|---|---|---|
| Deal deep link CTR | 4-8% | 12%+ |
| Booking conversion (deep-linked deal) | 5-10% | 15%+ |
| Price alert engagement | 25-40% | 50%+ |
| Loyalty deep link engagement | 30-45% | 55%+ |
Price alert deep links perform well because users are actively interested in the fare/rate and the deep link shows them the current price instantly.
Health/Fitness
| Metric | Benchmark Range | Top Performers |
|---|---|---|
| Challenge deep link CTR | 10-18% | 25%+ |
| Re-engagement (lapsed users) | 8-15% | 20%+ |
| Feature adoption (deep-linked) | 20-35% | 45%+ |
| Social share conversion | 3-6% | 10%+ |
Benchmarks by Channel
Email Deep Links
| Metric | Average | Good | Excellent |
|---|---|---|---|
| Click-through rate | 2-4% | 5-8% | 10%+ |
| App open rate | 60-70% | 75% | 85%+ |
| Conversion rate | 5-10% | 12-18% | 20%+ |
Push Notification Deep Links
| Metric | Average | Good | Excellent |
|---|---|---|---|
| Tap rate | 3-5% | 7-10% | 15%+ |
| App open rate | 90% | 95% | 98%+ |
| Action completion | 20-30% | 35-45% | 50%+ |
QR Code Deep Links
| Metric | Average | Good | Excellent |
|---|---|---|---|
| Scan rate (of viewers) | 5-10% | 12-18% | 25%+ |
| App open rate | 50-60% | 65-75% | 80%+ |
| Conversion rate | 8-15% | 18-25% | 30%+ |
Social Media Deep Links
| Metric | Average | Good | Excellent |
|---|---|---|---|
| Click-through rate | 1-3% | 4-6% | 8%+ |
| App open rate | 30-40% | 45-55% | 60%+ |
| Conversion rate | 2-5% | 6-10% | 12%+ |
Deferred Deep Link Benchmarks
For users who do not have the app installed:
| Metric | Benchmark |
|---|---|
| Click to app store | 60-80% of fallback visitors |
| App store to install | 30-50% (varies by app store page quality) |
| Install to first open | 80-90% |
| First open to correct screen | 85-95% (deferred deep link success) |
| End-to-end conversion (click to correct screen) | 15-35% |
The end-to-end deferred deep link conversion rate (15-35%) is the product of all steps. Every step that drops means fewer users reach the intended content.
How to Use Benchmarks
Identifying Issues
If your metric is significantly below the benchmark range:
| Your Metric | Benchmark | Possible Issue |
|---|---|---|
| App open rate < 50% | 65-75% | Universal Links / App Links misconfigured |
| Fallback rate > 40% (existing users) | 15-25% | AASA/assetlinks.json errors |
| Email CTR < 2% | 3-8% | Poor email content or targeting |
| Conversion < 5% (e-commerce) | 8-15% | Landing screen not optimized |
| Deferred success < 70% | 85-95% | Deferred deep link implementation bug |
Setting Targets
- Start with the "Average" benchmark for your industry.
- Set a goal to reach "Good" within 3 months.
- Iterate and optimize to reach "Excellent" over 6-12 months.
- Prioritize the metric with the largest gap between your current performance and the benchmark.
Tolinku for Benchmarking
Tolinku's analytics provide the metrics you need to benchmark your deep link performance: click-through rates, app open rates, fallback rates, and conversion rates by channel, campaign, and route. View your performance data in the Tolinku dashboard.
For CTR optimization, see click-through rate optimization for deep links. For deep link analytics, see deep link analytics: measuring what matters.
Get deep linking tips in your inbox
One email per week. No spam.