Media mix modeling (MMM) is a statistical approach that measures the impact of marketing channels on business outcomes using aggregate data. Unlike user-level attribution, MMM does not track individual users. It analyzes the relationship between marketing spend (by channel, by week) and total outcomes (installs, revenue) to determine which channels drive results.
This guide covers how MMM applies to mobile app marketing. For incrementality testing, see incrementality testing for mobile marketing. For attribution models, see last-click vs multi-touch attribution.
Why MMM Matters Now
MMM is experiencing a resurgence in mobile marketing because of privacy changes:
- ATT (iOS): With limited IDFA access, user-level attribution on iOS is incomplete.
- Privacy Sandbox (Android): Google is moving toward aggregate-level measurement.
- Cookie deprecation (web): Third-party cookies are going away.
MMM does not need user-level data. It works with aggregate data that is always available: total spend per channel per week, total installs per week, total revenue per week. Privacy regulations do not restrict this data.
MMM vs Attribution vs Incrementality
| Aspect | Attribution | Incrementality | MMM |
|---|---|---|---|
| Data level | User-level | User-level (experiment) | Aggregate |
| Privacy impact | High (needs user IDs) | Medium (needs user groups) | None |
| Measures | Who converted | What was incremental | What drives outcomes |
| Latency | Real-time | Weeks (experiment duration) | Monthly (model refresh) |
| Coverage | Digital channels only | One channel at a time | All channels (including offline) |
| Cost | Attribution SDK fee | Experiment setup + holdout cost | Data science + compute |
The three approaches are complementary:
- Attribution for day-to-day campaign management.
- Incrementality for validating specific channels.
- MMM for budget allocation across all channels.
How MMM Works
The Basic Model
MMM uses regression to model the relationship between marketing inputs and business outcomes:
Installs = f(Facebook_Spend, Google_Spend, TikTok_Spend, TV_Spend, Seasonality, Trend, ...)
A simplified linear model:
import statsmodels.api as sm
import pandas as pd

# Weekly data
data = pd.DataFrame({
    'installs': weekly_installs,         # Dependent variable
    'fb_spend': weekly_fb_spend,         # Independent variables
    'google_spend': weekly_google_spend,
    'tiktok_spend': weekly_tiktok_spend,
    'tv_spend': weekly_tv_spend,
    'is_holiday': weekly_is_holiday,      # Control variable
    'week_number': range(len(weekly_installs))  # Trend
})

X = data[['fb_spend', 'google_spend', 'tiktok_spend', 'tv_spend', 'is_holiday', 'week_number']]
X = sm.add_constant(X)
y = data['installs']

model = sm.OLS(y, X).fit()
print(model.summary())
Adstock (Carryover Effects)
Marketing spend has lasting effects. A TV ad today still influences installs next week. Adstock models this decay:
def apply_adstock(spend_series, decay_rate=0.5):
    """
    Apply geometric adstock transformation.
    decay_rate: 0 = no carryover, 1 = full carryover
    """
    adstocked = [spend_series[0]]
    for i in range(1, len(spend_series)):
        adstocked.append(spend_series[i] + decay_rate * adstocked[i-1])
    return adstocked
Different channels have different decay rates:
- TV: High carryover (decay = 0.7-0.9). Effects last weeks.
- Search: Low carryover (decay = 0.1-0.3). Effects are immediate.
- Social: Medium carryover (decay = 0.3-0.5).
- Display: Medium carryover (decay = 0.3-0.5).
Diminishing Returns
Doubling spend on a channel does not double installs. MMM models this with saturation curves:
def hill_saturation(spend, half_max, shape):
    """
    Hill function for diminishing returns.
    half_max: spend level at which 50% of maximum effect is reached
    shape: steepness of the curve (higher = sharper saturation)
    """
    return spend**shape / (half_max**shape + spend**shape)
This produces an S-curve where:
- Low spend has increasing marginal returns (getting started).
- Medium spend has linear returns.
- High spend has decreasing marginal returns (saturation).
Open-Source MMM Tools
Several open-source tools make MMM accessible without building from scratch:
| Tool | Developer | Language | Features |
|---|---|---|---|
| Robyn | Meta | R | Automated hyperparameter tuning, budget allocation |
| LightweightMMM | Python (JAX) | Bayesian modeling, media saturation | |
| PyMC-Marketing | PyMC Labs | Python | Bayesian MMM + CLV, flexible |
| Orbit | Uber | Python | Time series forecasting with marketing variables |
Getting Started with Robyn
# Install Robyn
# install.packages("Robyn")
library(Robyn)

# Prepare input data
InputCollect <- robyn_inputs(
  dt_input = weekly_data,
  dt_holidays = holidays,
  date_var = "date",
  dep_var = "installs",
  dep_var_type = "conversion",
  paid_media_spends = c("fb_spend", "google_spend", "tiktok_spend"),
  paid_media_vars = c("fb_impressions", "google_clicks", "tiktok_impressions"),
  organic_vars = c("seo_visits", "email_clicks"),
  context_vars = c("competitor_spend", "is_promotion"),
  window_start = "2025-01-01",
  window_end = "2026-06-30",
  adstock = "geometric"
)

# Run model
OutputModels <- robyn_run(InputCollect, iterations = 2000, trials = 5)
Data Requirements
Minimum Data
- Time range: 2+ years of weekly data (104+ data points). More is better.
- Spend variation: Channels must have meaningful spend variation (increases, decreases, pauses). If spend is constant, the model cannot measure its effect.
- Outcome data: Weekly installs, revenue, or the business metric you want to optimize.
Additional Data
| Data Type | Examples | Why It Helps |
|---|---|---|
| Seasonality | Holidays, back-to-school, tax season | Controls for natural demand fluctuations |
| Competitor activity | Competitor ad spend, launches | Controls for market-level effects |
| Macroeconomic | Unemployment rate, consumer confidence | Controls for economic conditions |
| Product changes | App updates, pricing changes, new features | Controls for non-marketing effects |
| PR/earned media | Press mentions, viral moments | Accounts for non-paid influence |
Budget Optimization
The primary output of MMM is optimal budget allocation:
# Example optimization output
optimal_budget = {
    'facebook': {'current': 50000, 'optimal': 35000, 'change': -30},
    'google': {'current': 40000, 'optimal': 55000, 'change': +37.5},
    'tiktok': {'current': 30000, 'optimal': 25000, 'change': -17},
    'tv': {'current': 80000, 'optimal': 85000, 'change': +6}
}
# Total budget stays the same ($200,000)
# Model predicts 15% more installs with the optimized allocation
The model identifies that Google is underspent (high marginal returns) and Facebook is overspent (diminishing returns at current level).
Limitations
- Requires historical data. New channels with no historical data cannot be modeled.
- Aggregate only. Cannot optimize individual campaigns or creatives.
- Correlation vs causation. MMM measures correlation; incrementality tests prove causation.
- Slow feedback loop. Models are refreshed monthly or quarterly, not in real-time.
- Assumes stationarity. The model assumes relationships are stable. Major market changes invalidate it.
Tolinku for Marketing Measurement
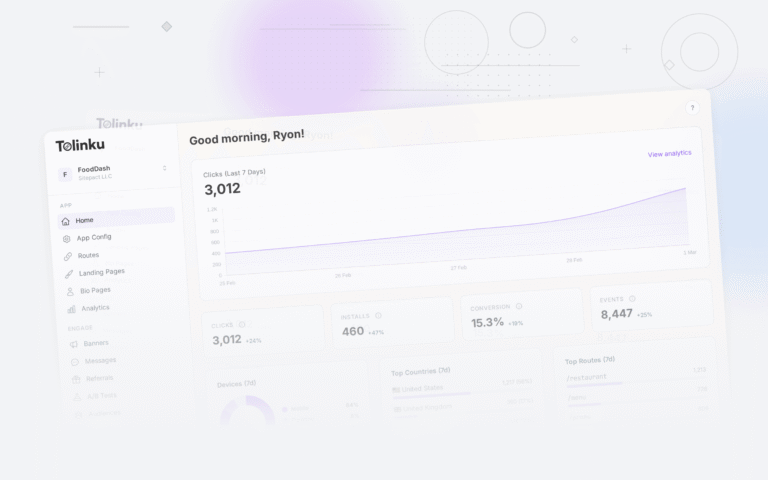
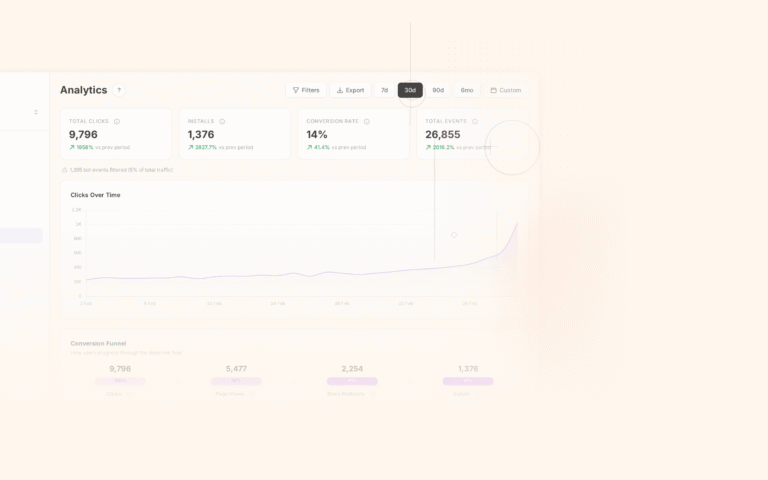
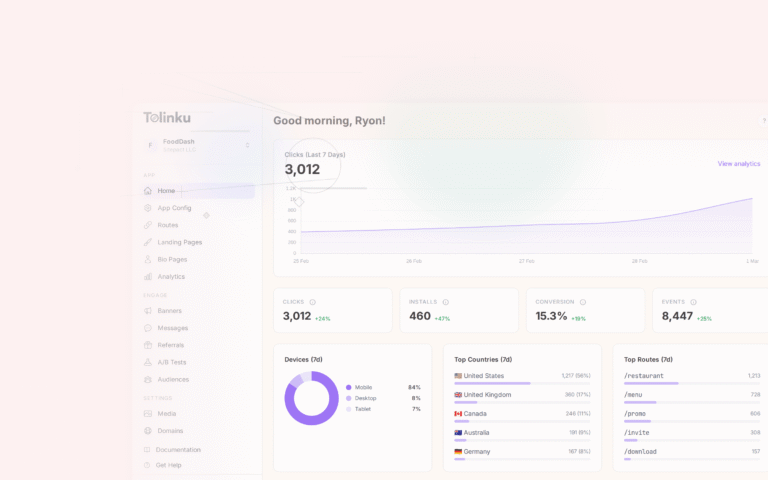
Tolinku's analytics provide aggregate deep link click and conversion data that can be used as input variables in MMM. Export weekly click and conversion data from the Tolinku dashboard to include deep link campaigns in your media mix model.
For incrementality testing, see incrementality testing for mobile marketing. For mobile attribution, see mobile attribution: a developer's guide.
Get deep linking tips in your inbox
One email per week. No spam.