Printing a QR code on marketing materials without tracking scans is like running a digital ad campaign without click data. You're spending money and hoping for results, with no way to measure what's working.
QR code analytics bridge the gap between offline marketing and measurable outcomes. When implemented properly, you can track every scan, understand your audience, and attribute downstream conversions back to specific physical touchpoints.
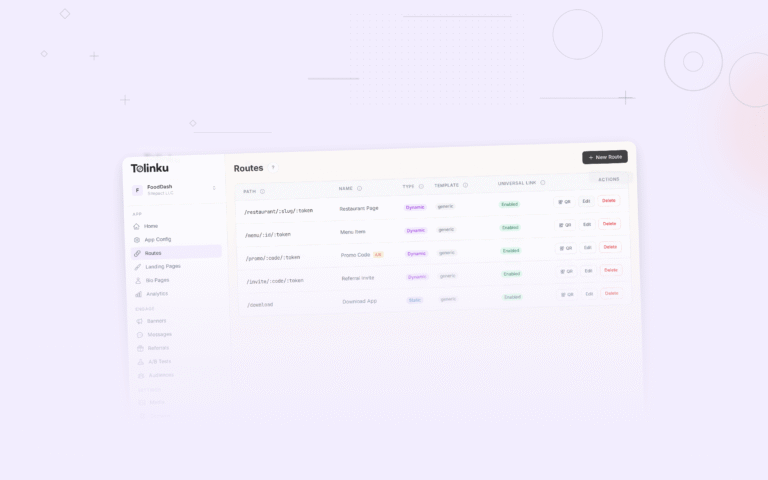
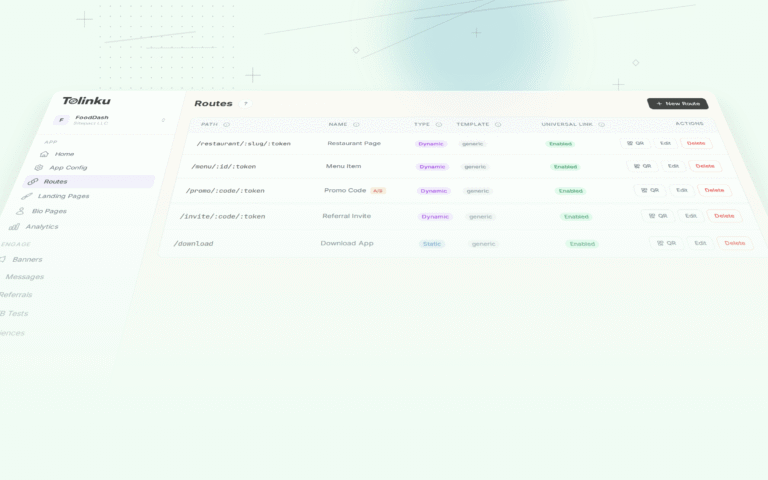
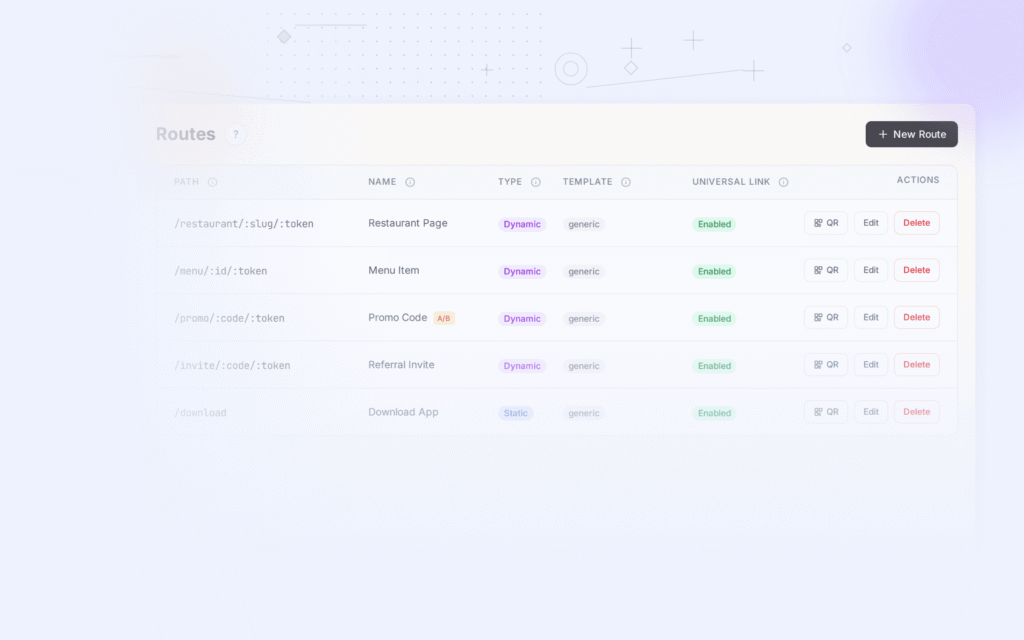
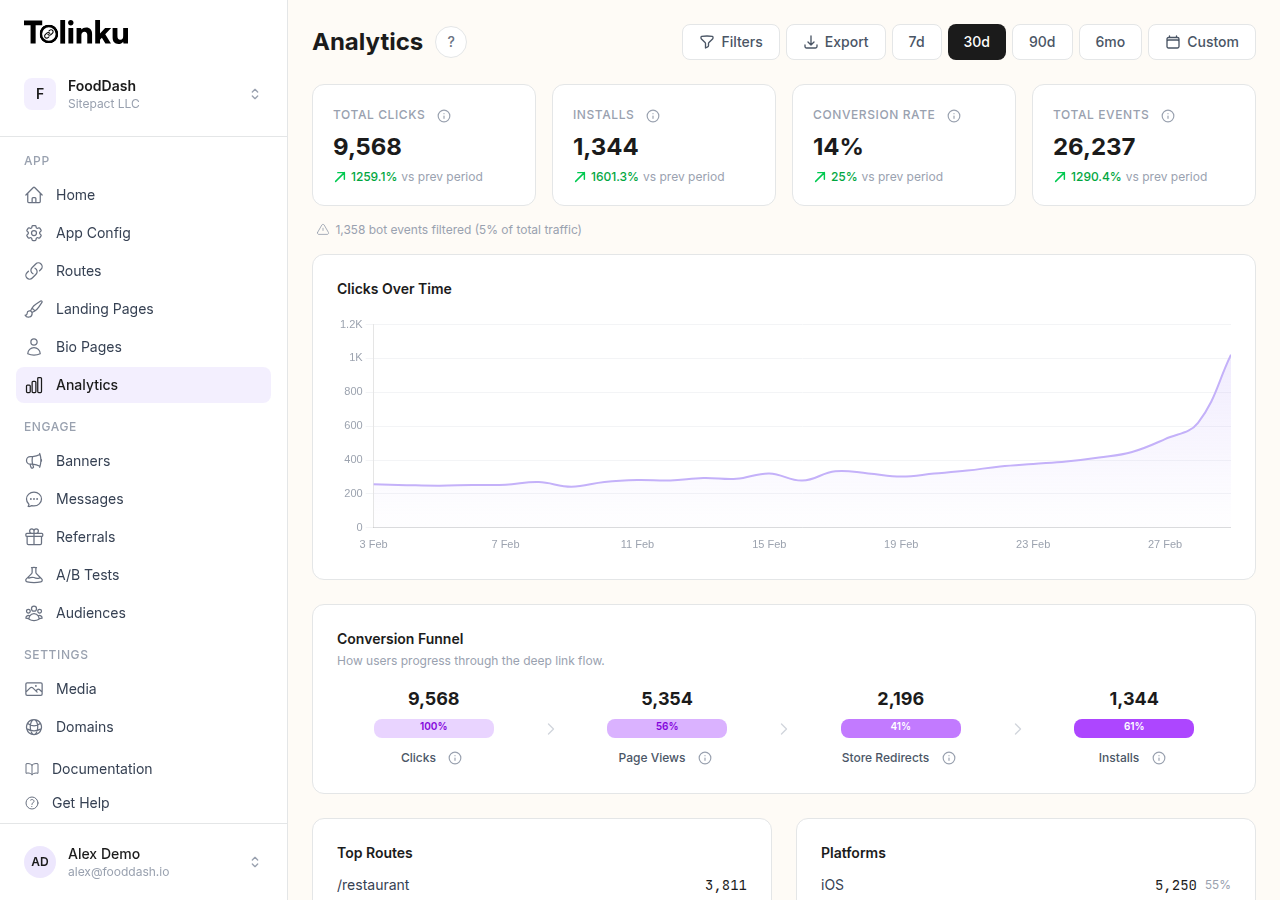
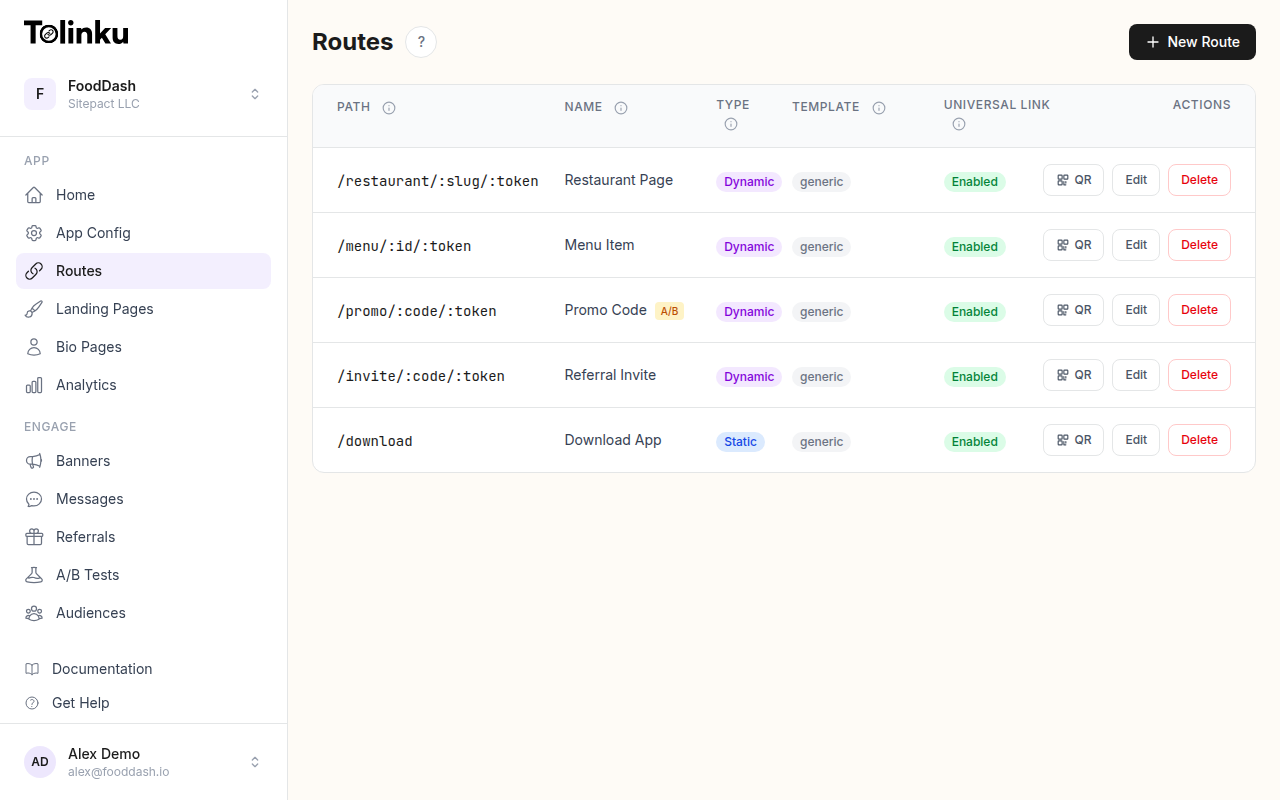 Tolinku route configuration with QR code generation for each deep link.
What You Can Measure
Modern QR code analytics go far beyond simple scan counts. Here's what a properly instrumented setup captures:
Scan Volume and Trends
- Total scans: Raw count of how many times the code was scanned
- Unique scans: Deduplicated by device or IP, representing distinct users
- Scans over time: Daily, weekly, or hourly trends showing when engagement peaks
- Scan velocity: How quickly scans accumulate after deployment (useful for gauging initial interest)
Geographic Data
Every scan carries an IP address that can be mapped to a geographic location:
- Country and region: Which markets are engaging with your codes
- City-level data: Useful for local campaigns or store-specific promotions
- Heatmaps: Visualize scan density across locations
Geographic data is especially valuable for businesses with multiple physical locations. If you've placed the same QR code in 50 stores, you can see which locations generate the most engagement.
Device and Platform Breakdown
- Operating system: iOS vs. Android split (critical for app download campaigns)
- Device type: Phone vs. tablet
- Browser or app: Whether the scan originated from the native camera app, a QR scanner app, or a browser
This data informs your mobile strategy. If 80% of your scans come from iOS users, prioritize the iOS app experience on your landing page.
Referrer and Context
- Scan source: Which camera app or QR reader was used
- UTM parameters: If your QR code URL includes UTM tags, these flow through to your analytics
- Campaign attribution: Which physical campaign or material generated the scan
Setting Up QR Code Tracking
The key requirement for QR code analytics is using dynamic QR codes rather than static ones. Static codes encode URLs directly and bypass any server, so there's no opportunity to record analytics.
Step 1: Create Tracked Routes
In Tolinku, create a route for each QR code campaign. Each route generates its own QR code and tracks scans independently.
For campaigns with multiple placements, create separate routes for each:
/summer-sale-store-frontfor the window display/summer-sale-receiptfor printed receipts/summer-sale-flyerfor flyers
This gives you per-placement analytics so you can compare performance across channels.
Step 2: Add UTM Parameters
Append UTM parameters to your destination URLs for integration with Google Analytics or other web analytics tools:
https://yourstore.com/summer?utm_source=qr&utm_medium=print&utm_campaign=summer_2026&utm_content=store_window
The UTM parameters travel through the redirect and appear in your web analytics, connecting QR scan data to on-site behavior.
Step 3: Configure Conversion Tracking
The scan is just the first step. To measure the full funnel, you need to track what happens after the scan:
- Scan (tracked by QR code analytics)
- Page view (tracked by web analytics)
- App install (tracked by your deep linking platform)
- In-app action (tracked by your app analytics)
With Tolinku's analytics, you can see the click-to-install conversion funnel. Combine this with your web analytics to get a complete picture from scan to purchase.
Key Metrics for QR Code Campaigns
Scan Rate
Scan rate = total scans / total impressions (estimated). If you printed 5,000 flyers and got 150 scans, your scan rate is 3%. Industry benchmarks vary widely by context:
| Placement | Typical Scan Rate |
|---|---|
| Product packaging | 2-5% |
| Restaurant table card | 15-40% |
| Retail store window | 1-3% |
| Business card | 5-10% |
| Billboard | 0.1-0.5% |
| Direct mail | 3-8% |
Low scan rates often indicate design or placement problems rather than lack of interest. See QR Code Design Best Practices for tips on improving scannability and engagement.
Scan-to-Action Conversion
Of the people who scan your code, how many complete the desired action? This metric reveals whether the post-scan experience is effective.
Common actions to track:
- App download
- Account creation
- Purchase
- Form submission
- Content view (minimum time on page)
If your scan volume is high but conversions are low, the problem is likely your landing page, not your QR code.
Time-Based Patterns
Analyze when scans occur to optimize your campaigns:
- Time of day: Are scans concentrated during business hours? Lunch breaks? Evenings?
- Day of week: Weekday vs. weekend patterns
- Decay curve: How quickly do scans drop off after deployment?
These patterns help you time your campaigns. If restaurant table cards get most scans between noon and 2 PM, that's when your mobile experience needs to be at its best.
Geographic Performance
Compare scan rates across locations to identify your strongest markets:
- Which stores or regions drive the most engagement?
- Are there underperforming locations where the QR code might be poorly placed?
- Do different regions respond to different types of promotions?
Use Tolinku's analytics filtering to segment data by country, platform, or device type.
Comparing QR Code Placements
When running QR codes across multiple channels, use separate routes for each placement to enable direct comparison.
A/B Testing QR Code Designs
Create two versions of the same QR code with different:
- Call-to-action text
- Surrounding design
- Placement position (top of flyer vs. bottom)
- Size (standard vs. oversized)
Direct each version to a different route and compare scan rates. The analytics will tell you which design performs better.
Cross-Channel Comparison
Track the same campaign across different physical channels:
| Channel | Route | Scans | Conversions | CPA |
|---|---|---|---|---|
| In-store poster | /promo-poster |
342 | 28 | $3.57 |
| Receipt insert | /promo-receipt |
189 | 31 | $1.61 |
| Direct mail | /promo-mailer |
67 | 12 | $8.33 |
This data drives budget allocation decisions. In the example above, receipt inserts have the lowest cost per acquisition, making them the most efficient channel.
Reporting and Export
For deeper analysis or integration with other tools, export your analytics data as CSV. This lets you:
- Build custom dashboards in tools like Google Data Studio or Tableau
- Combine QR scan data with sales data from your POS system
- Generate reports for stakeholders that show offline marketing ROI
Webhooks for Real-Time Data
For programmatic access to scan events, use webhooks. Each scan triggers a link.clicked event that can be sent to your backend in real time. This enables:
- Real-time dashboards showing live scan activity
- Automated alerts when scan velocity spikes or drops
- Integration with CRM systems to enrich customer profiles with offline engagement data
For a broader look at how analytics apply to deep linking in general, see Deep Link Analytics: Measuring What Matters.
Making Data-Driven Decisions
QR code analytics transform offline marketing from a "spray and pray" approach into a measurable, optimizable channel. Start by tracking scan volume and geographic data. Then layer in conversion tracking to connect scans to business outcomes. Over time, use the data to refine your placements, designs, and calls-to-action.
For more on QR codes in mobile marketing, see QR Codes and Short Links for Mobile Apps.
Get deep linking tips in your inbox
One email per week. No spam.