A webhook integration that works today can silently break tomorrow. An SSL certificate expires, a server runs out of disk space, a deployment changes a route, or a firewall rule blocks the webhook IP. Without monitoring, you don't know events are being lost until someone asks why the analytics don't add up.
This guide covers how to monitor Tolinku webhook delivery from both sides: what Tolinku provides in its dashboard, and what you should track on your receiver. For the initial webhook setup, see the webhook setup guide. For debugging specific issues, see the webhook debugging guide.
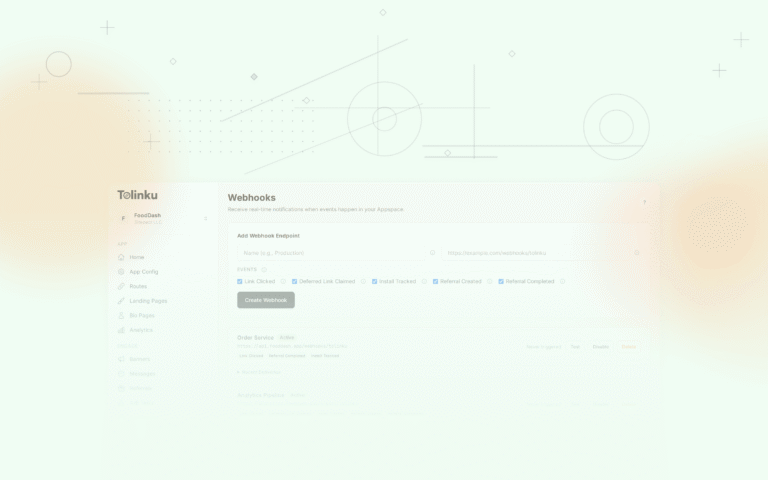
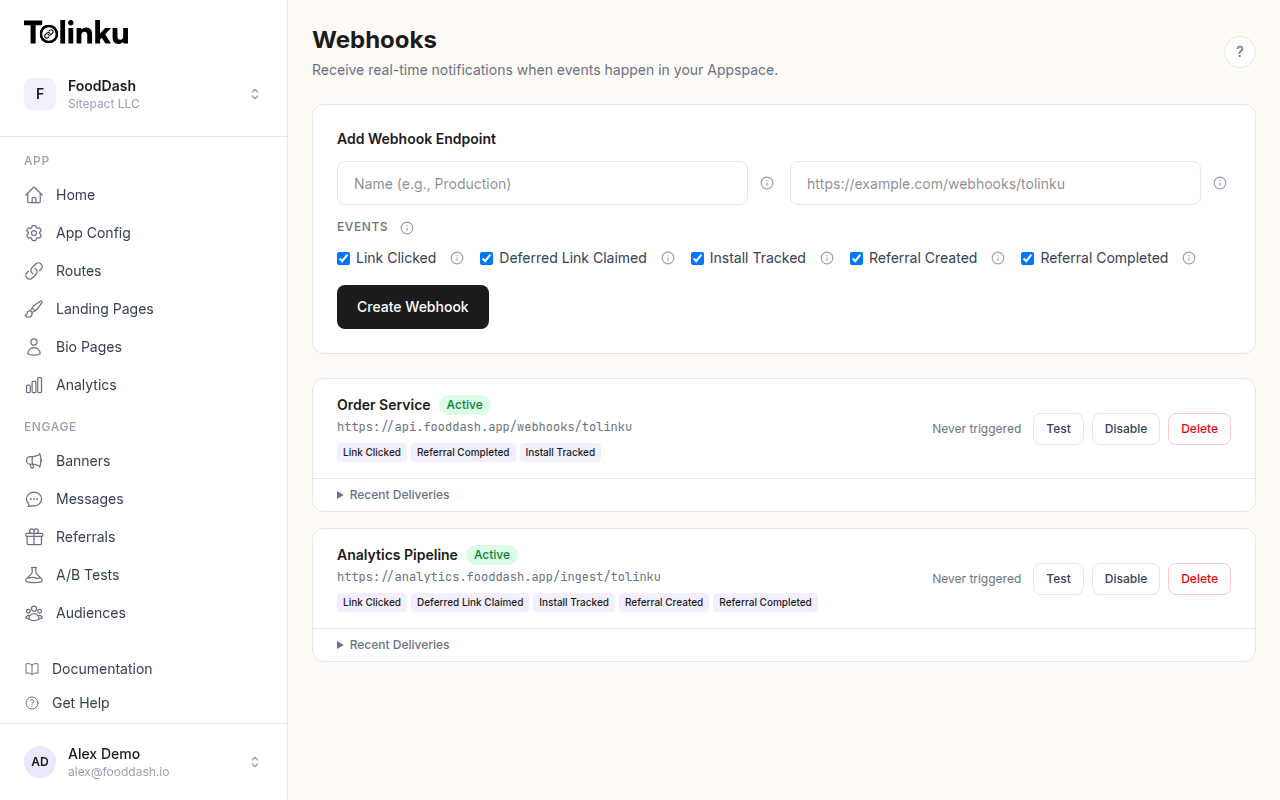 The webhooks page with create form, webhook list, and delivery log.
What Tolinku Tracks
Every webhook delivery is logged with:
- delivery_id: Unique identifier for the delivery attempt
- event_type: The event that triggered the delivery (e.g.,
link.clicked) - timestamp: When the delivery was attempted
- status_code: The HTTP response code your endpoint returned (0 if timeout or network error)
- response_time_ms: How long your endpoint took to respond
- success: Whether the delivery was considered successful (status 200-299)
- error_message: Description of the failure (e.g., "Timeout", connection refused)
- attempt: Which attempt this was (1 for the initial delivery, 2-4 for retries)
Each webhook endpoint in the dashboard also shows:
- last_triggered_at: When the most recent event was sent
- last_status_code: The response from the most recent delivery
You can view the last 50 deliveries per webhook in the Tolinku dashboard.
What You Should Track (Receiver Side)
The dashboard shows what Tolinku sent. Your receiver should track what it received and how it processed the events. These metrics form a complete picture.
Key Metrics
Events received per minute. Track the count of webhook requests hitting your endpoint. A sudden drop means either Tolinku stopped sending (check the dashboard) or your receiver is unreachable.
Processing latency. Time from receiving the webhook to completing your handler logic (database write, API call, queue push). High processing latency means your handler is doing too much synchronously. Respond with 200 first, then process asynchronously.
Error rate by type. Categorize errors:
- Signature verification failures (potential security issue or misconfigured secret)
- Downstream failures (database down, API timeout, queue full)
- Parsing failures (unexpected payload format)
Duplicate rate. How often you receive the same event more than once. Some duplication is normal (retries after timeouts), but a high rate might indicate your endpoint is responding too slowly, causing Tolinku to retry events that were actually received.
Structured Logging
Log every webhook request with structured fields so you can query and aggregate:
import express from 'express';
import crypto from 'crypto';

const app = express();
app.use('/webhooks', express.raw({ type: 'application/json' }));

app.post('/webhooks/tolinku', async (req, res) => {
  const startTime = Date.now();
  const eventType = req.headers['x-webhook-event'] as string;

  // Verify signature
  const signature = req.headers['x-webhook-signature'] as string;
  const expected = crypto
    .createHmac('sha256', process.env.WEBHOOK_SECRET!)
    .update(req.body)
    .digest('hex');

  if (signature !== expected) {
    console.log(JSON.stringify({
      level: 'warn',
      type: 'webhook_signature_failed',
      event_type: eventType,
      ip: req.ip,
    }));
    return res.status(401).send('Invalid signature');
  }

  // Respond immediately
  res.status(200).send('OK');
  const responseTime = Date.now() - startTime;

  const event = JSON.parse(req.body.toString());

  // Generate dedup key
  const eventHash = crypto
    .createHash('sha256')
    .update(req.body)
    .digest('hex')
    .substring(0, 16);

  try {
    await processEvent(event);

    console.log(JSON.stringify({
      level: 'info',
      type: 'webhook_processed',
      event_type: eventType,
      event_hash: eventHash,
      response_time_ms: responseTime,
      processing_time_ms: Date.now() - startTime,
      timestamp: event.timestamp,
    }));
  } catch (err: any) {
    console.log(JSON.stringify({
      level: 'error',
      type: 'webhook_processing_failed',
      event_type: eventType,
      event_hash: eventHash,
      error: err.message,
      response_time_ms: responseTime,
    }));
  }
});
Building a Monitoring Dashboard
Whether you use Grafana, Datadog, or a custom dashboard, track these panels:
1. Delivery Success Rate
-- Success rate over the last hour (from your receiver logs)
SELECT
  date_trunc('minute', received_at) AS minute,
  COUNT(*) AS total,
  COUNT(*) FILTER (WHERE status = 'processed') AS success,
  ROUND(
    COUNT(*) FILTER (WHERE status = 'processed')::numeric / COUNT(*) * 100,
    1
  ) AS success_rate
FROM webhook_logs
WHERE received_at > NOW() - INTERVAL '1 hour'
GROUP BY minute
ORDER BY minute;
A healthy integration maintains 99%+ success rate. A dip below 95% warrants investigation.
2. Response Time Distribution
Track the p50, p95, and p99 response times of your endpoint. Tolinku times out after 10 seconds, so if your p95 approaches that threshold, you're at risk of timeouts triggering retries.
Target: p95 under 500ms. If processing takes longer, respond with 200 first and process asynchronously.
3. Events by Type Over Time
A time series of event counts broken down by type. This reveals:
- Traffic patterns (when are your links most clicked?)
- Campaign launches (sudden spike in
link.clicked) - Conversion health (is the ratio of clicks to installs stable?)
4. Retry Rate
Track how many events arrive as retries (attempt > 1). A rising retry rate means your endpoint is failing more often.
If you can identify retries (by detecting duplicate event hashes), chart the dedup rate over time. Normal is under 1%. Above 5% means something is consistently failing.
Alerting
Set up alerts for these conditions:
No Events Received
If your receiver hasn't received a webhook in the last N minutes (where N depends on your traffic volume), something is wrong. For high-traffic apps, alert after 5 minutes of silence. For low-traffic apps, alert after 1 hour.
// Simple staleness check
let lastEventTime = Date.now();

app.post('/webhooks/tolinku', (req, res) => {
  lastEventTime = Date.now();
  // ... process
});

setInterval(() => {
  const silenceMinutes = (Date.now() - lastEventTime) / 60000;
  if (silenceMinutes > 15) {
    sendAlert(`No webhook events received in ${Math.round(silenceMinutes)} minutes`);
  }
}, 60000);
High Error Rate
Alert when the error rate exceeds 5% over a 10-minute window. Errors include signature failures, processing exceptions, and downstream failures.
Slow Response Times
Alert when p95 response time exceeds 5 seconds. At that point, you're at risk of timeouts on the next traffic spike.
Signature Failures
Any signature verification failure should trigger an alert. Either someone is sending fake requests to your endpoint, or your webhook secret is misconfigured. Both warrant immediate attention.
Health Check Endpoint
Add a health check endpoint to your receiver so your monitoring system can verify it's running:
app.get('/health', (req, res) => {
  const silenceMinutes = (Date.now() - lastEventTime) / 60000;

  res.json({
    status: 'ok',
    last_event_received: new Date(lastEventTime).toISOString(),
    minutes_since_last_event: Math.round(silenceMinutes),
    uptime_seconds: Math.round(process.uptime()),
  });
});
Point your uptime monitor (UptimeRobot, Pingdom, or a simple cron curl) at this endpoint.
Reconciliation
Even with monitoring, events can be lost. Periodic reconciliation compares what Tolinku sent with what your receiver processed.
Approach
- Query the Tolinku analytics API for event counts over a time range
- Query your receiver's logs for event counts over the same range
- Compare the totals
If the numbers diverge by more than 1-2% (accounting for timing differences at range boundaries), investigate:
- Check the delivery logs in the Tolinku dashboard for failed deliveries
- Check your receiver logs for processing errors
- Look for gaps in your receiver's uptime
Automated Reconciliation
Run a daily job that compares counts and alerts on significant discrepancies:
async function reconcile() {
  // Count events your receiver processed yesterday
  const result = await db.query(`
    SELECT event_type, COUNT(*) as count
    FROM webhook_logs
    WHERE received_at >= CURRENT_DATE - INTERVAL '1 day'
      AND received_at < CURRENT_DATE
    GROUP BY event_type
  `);

  const receiverCounts = Object.fromEntries(
    result.rows.map(r => [r.event_type, parseInt(r.count)])
  );

  // Compare with expected counts from your analytics
  // If discrepancy > 2%, alert
  for (const [eventType, count] of Object.entries(receiverCounts)) {
    console.log(`${eventType}: ${count} events received`);
  }
}
Runbook: Common Issues
| Symptom | Likely Cause | Fix |
|---|---|---|
| All deliveries failing with status 0 | Endpoint unreachable | Check DNS, firewall rules, SSL certificate |
| Status 401 on all deliveries | Signature mismatch | Verify the webhook secret matches between Tolinku and your receiver |
| Status 500 intermittently | Application error | Check your receiver logs for exceptions |
| Status 503 during high traffic | Server overloaded | Scale your receiver or add a queue between receiver and processing |
| Timeouts (10s) | Slow processing | Respond 200 immediately, process asynchronously |
| Duplicate events increasing | Endpoint slow or flaky | Fix the root cause of failures/timeouts |
For detailed debugging techniques, see the webhook debugging guide. For retry behavior details, see the webhook retry logic guide.
Get deep linking tips in your inbox
One email per week. No spam.