You can not improve what you do not measure. That principle applies everywhere, but it hits especially hard with deep links. Teams invest weeks building deep link infrastructure, configuring Universal Links and App Links, setting up fallbacks, and polishing the user experience. Then they launch, share links across channels, and have almost no idea what is happening on the other side.
Deep link analytics close that gap. They tell you which links are working, where users are dropping off, which channels are driving real engagement, and whether your deep linking investment is paying off. Without them, you are flying blind.
This guide covers the metrics that matter, how to build attribution funnels, how to structure UTM parameters for deep links, and how to turn raw click data into decisions.
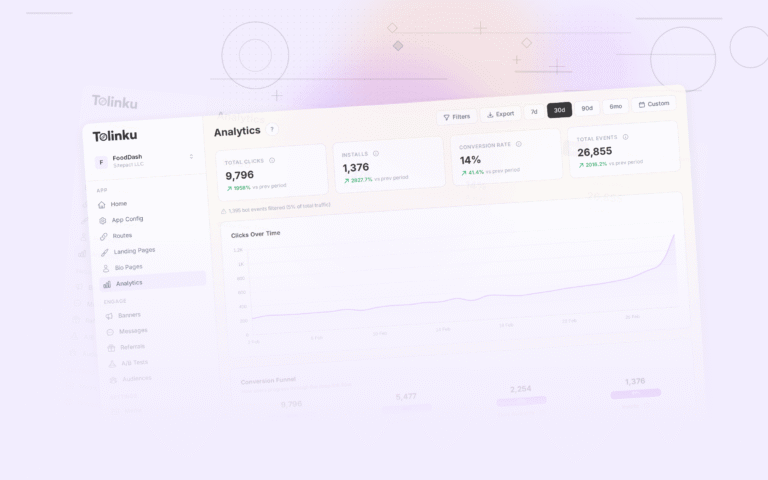
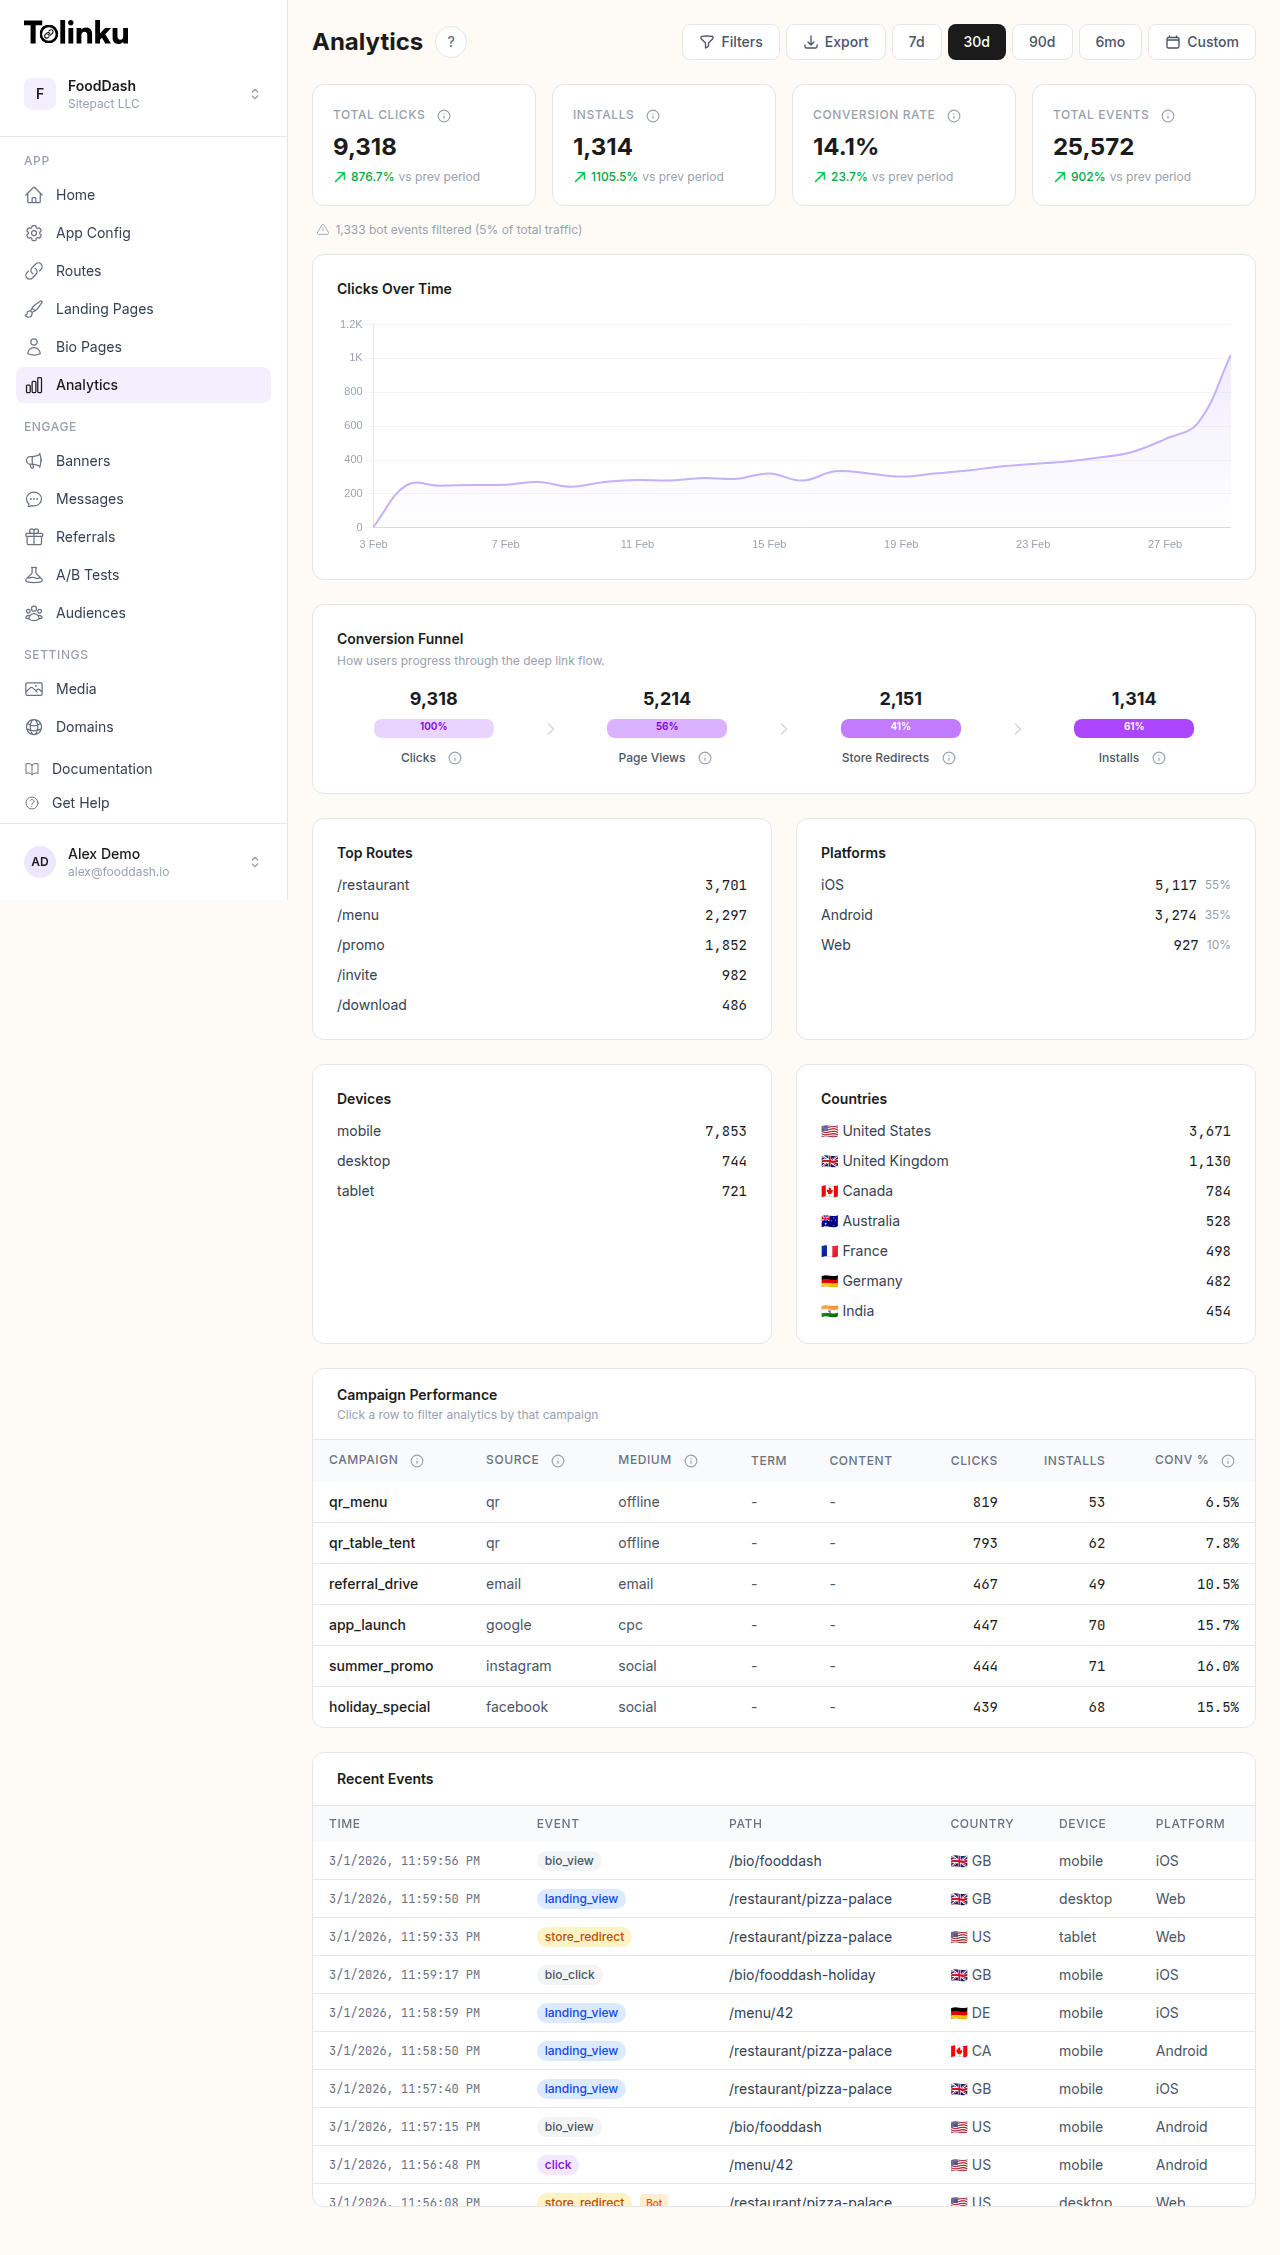 The analytics dashboard with date range selector, filters, charts, and breakdowns.
Key Deep Link Metrics
Not every metric deserves a spot on your dashboard. Some numbers look impressive but tell you nothing useful. Here are the ones that actually drive decisions.
Total Clicks
The most basic metric: how many times a deep link was tapped or clicked. This gives you a rough sense of reach, but it is easily inflated by bots, accidental taps, and repeat visitors. Treat total clicks as a starting point, not an endpoint.
Unique Clicks
Unique clicks deduplicate by device or user, giving you a more accurate picture of how many distinct people interacted with a link. The gap between total clicks and unique clicks tells you something useful too. A high ratio of total to unique clicks might mean users are tapping the same link repeatedly (possibly because the app is not opening correctly).
Click-Through Rate (CTR)
CTR measures how many people who saw a link actually clicked it. This depends on where the link appears: an email, a push notification, a social media post, a QR code on a poster. CTR is channel-dependent, so compare within channels rather than across them.
CTR = (unique clicks / impressions) * 100
A 2% CTR on a cold email is solid. A 2% CTR on a push notification sent to active users is a problem.
App Open Rate
Of the users who clicked a deep link, how many actually landed in the app? The difference between click and app open reveals fallback friction. If 60% of clicks result in app opens, the other 40% likely hit the web fallback, landed on the app store, or bounced entirely. This metric is your canary for broken link configurations.
App Open Rate = (app opens from deep link / unique clicks) * 100
Install Rate (Deferred Deep Links)
For deferred deep links, install rate tracks how many users who did not have the app went ahead and installed it. This metric is critical for acquisition campaigns.
Install Rate = (new installs from deep link / clicks from non-installed users) * 100
Re-engagement Rate
For users who already have the app, re-engagement rate measures how many clicked a deep link and then completed a meaningful action (viewed a product, started a session longer than 30 seconds, made a purchase). Raw app opens are not enough. You want to know whether the deep link actually pulled users back into active usage.
Conversion Rate
The metric that pays the bills. Of all the users who clicked a deep link, how many completed the goal you defined? That goal could be a purchase, a sign-up, a content view, or any other action you care about.
Conversion Rate = (conversions / unique clicks) * 100
Building Attribution Funnels
Individual metrics are useful, but the real power comes from connecting them into a funnel. A deep link attribution funnel traces the user journey from first click to final conversion.
The Standard Deep Link Funnel
Click → App Open → Screen View → Action → Conversion
For deferred deep links, the funnel extends:
Click → Store Visit → Install → First Open → Screen View → Action → Conversion
Every step in the funnel is a potential drop-off point. Your job is to measure each transition and figure out where you are losing people. Our guide on conversion funnel analysis for deep links covers optimization strategies for each stage.
Setting Up Attribution
Attribution connects a conversion back to the click that started the journey. There are several approaches:
Last-click attribution credits the most recent deep link click before a conversion. It is the simplest model and works well for most deep linking use cases.
First-click attribution credits the first deep link a user ever clicked. This matters when you want to understand which channels bring users in the door, even if a later touchpoint closes the deal.
Multi-touch attribution distributes credit across multiple touchpoints. It is more accurate for complex user journeys but harder to implement and interpret.
For most teams, last-click attribution is the right starting point. You can layer in multi-touch models later as your analytics mature.
Implementing Funnel Tracking
Server-side tracking is more reliable than client-side for deep link funnels. Here is a basic pattern for logging funnel events:
// Server-side event logging
async function logDeepLinkEvent(event) {
  await analytics.insert({
    event_type: event.type,       // 'click', 'app_open', 'screen_view', 'conversion'
    link_id: event.linkId,
    user_id: event.userId,        // null for anonymous clicks
    device_id: event.deviceId,
    platform: event.platform,     // 'ios', 'android', 'web'
    channel: event.channel,       // 'email', 'social', 'push', 'qr'
    campaign: event.campaign,
    timestamp: Date.now(),
    metadata: event.metadata      // screen name, conversion value, etc.
  });
}
On the client side (in your mobile app), fire events at each funnel stage:
// iOS SDK: track deep link open and subsequent actions
func application(_ application: UIApplication,
                 continue userActivity: NSUserActivity,
                 restorationHandler: @escaping ([UIUserActivityRestoring]?) -> Void) -> Bool {
    guard let url = userActivity.webpageURL else { return false }

    // Track the app open
    Analytics.logEvent("deep_link_open", parameters: [
        "url": url.absoluteString,
        "source": url.queryParameter("utm_source") ?? "direct"
    ])

    // Route to the correct screen
    DeepLinkRouter.handle(url) { screen in
        // Track the screen view
        Analytics.logEvent("screen_view", parameters: [
            "screen": screen.name,
            "from_deep_link": true
        ])
    }

    return true
}
UTM Parameters for Deep Links
UTM parameters originated in web analytics, but they work just as well for deep links. They let you tag every link with metadata about where it came from, which campaign it belongs to, and what content it points to.
The Five Standard UTM Parameters
| Parameter | Purpose | Example |
|---|---|---|
utm_source |
Where the traffic comes from | newsletter, instagram, partner_blog |
utm_medium |
The marketing medium | email, social, cpc, qr, push |
utm_campaign |
The specific campaign | spring_sale_2026, onboarding_week2 |
utm_content |
Differentiates link variants | hero_button, footer_link, variant_b |
utm_term |
Paid search keyword | running_shoes, meal_delivery |
Naming Conventions
Inconsistent UTM naming is the fastest way to ruin your analytics. Set rules early and enforce them.
Use lowercase everything. Email and email will show up as separate sources in most analytics tools.
Use underscores, not spaces or hyphens. spring_sale is cleaner than spring-sale or spring%20sale.
Be specific but not verbose. newsletter_march_2026 is better than nl_03 (too cryptic) or monthly_newsletter_march_2026_edition_spring (too long).
Document your conventions. Maintain a shared spreadsheet or wiki page listing approved source, medium, and campaign values. If everyone on the team invents their own naming scheme, your reports will be full of duplicate entries.
Example: Deep Link with UTM Parameters
https://yourapp.link/product/shoes-123
  ?utm_source=instagram
  &utm_medium=social
  &utm_campaign=spring_sale_2026
  &utm_content=story_swipe_up
When this link is clicked, your deep link analytics platform captures all four parameters. You can then filter your reports by source, medium, or campaign to compare performance across channels. For a deeper dive into UTM strategy with short links, see UTM Parameters and Short Links.
Channel-Specific Tracking
Different channels behave differently. A deep link in an email does not face the same challenges as one in an Instagram bio. Your tracking strategy should account for these differences.
Email deep links are straightforward to track because you control the entire link. Append UTM parameters to every link, and use utm_content to differentiate between links in the same email (header CTA vs. footer link vs. inline product link).
Watch for email clients that pre-fetch links. Some corporate email gateways (Microsoft Safe Links, for example) will click every link in an email before the user sees it. This inflates click counts unless your analytics platform filters bot traffic.
Social Media
Social platforms often wrap links in their own redirects (like l.facebook.com or t.co). This can interfere with Universal Links and App Links because the OS sees the redirect domain, not your domain. Make sure your deep link service handles these redirects correctly.
For platforms that do not allow clickable links (Instagram captions, TikTok bios), use a link-in-bio page that aggregates multiple deep links. Track each link separately with distinct utm_content values.
Paid Ads
Paid channels add complexity because ad platforms (Google Ads, Meta Ads, TikTok Ads) have their own tracking parameters. You need to reconcile your deep link analytics with ad platform reporting.
The simplest approach: pass the ad platform's click ID through the deep link as a query parameter.
https://yourapp.link/promo/summer
  ?utm_source=meta
  &utm_medium=cpc
  &utm_campaign=summer_retargeting
  &fbclid={fbclid}
This lets you join your deep link data with Meta's reporting data later.
QR Codes
QR codes are unique because you cannot see impressions. A QR code on a poster in a subway station might be seen by 10,000 people, but you will only ever know about the ones who scanned it. Focus on scans (clicks) and downstream conversions rather than CTR.
Tag each QR code with a distinct utm_content or even a unique link so you can track performance by location.
https://yourapp.link/menu
  ?utm_source=qr
  &utm_medium=print
  &utm_campaign=restaurant_launch
  &utm_content=table_tent_downtown
Push Notifications
Push notifications have the highest intent signal of any channel because you are reaching users who already have your app and have opted in. Deep links in push notifications should track the notification ID and any A/B test variant.
{
  "notification": {
    "title": "Your order is ready",
    "body": "Tap to track your delivery"
  },
  "data": {
    "deep_link": "https://yourapp.link/order/789",
    "utm_source": "push",
    "utm_medium": "notification",
    "utm_campaign": "order_status",
    "notification_id": "notif_abc123"
  }
}
Building Dashboards
A dashboard is only useful if it helps someone make a decision. Resist the urge to cram every metric onto one screen. Instead, build dashboards for specific audiences.
Executive Dashboard
Executives want the big picture. For more on structuring these views, see building attribution dashboards. Show them:
- Total deep link clicks (7-day and 30-day trends)
- Overall conversion rate
- Top 3 performing campaigns
- Revenue attributed to deep links (if applicable)
Keep it to four or five widgets. If an executive has to scroll, you have lost them.
Marketing Dashboard
Marketing teams need channel-level data:
- Clicks and conversions broken down by source and medium
- Campaign performance comparison (table or bar chart)
- CTR by channel over time
- Top performing links
Include the ability to filter by date range, campaign, and platform (iOS vs. Android). Tolinku's analytics filtering supports these breakdowns out of the box.
Engineering Dashboard
Engineers care about reliability:
- Deep link resolution success rate
- Fallback trigger rate (how often the web fallback fires instead of the app)
- Latency (time from click to app open)
- Error rates by platform and OS version
Choosing Time Ranges
Default to 7-day and 30-day views. Shorter windows (24 hours, 48 hours) are useful for monitoring campaign launches. Longer windows (90 days, quarter-over-quarter) help with trend analysis and planning.
Always let users change the time range. A dashboard locked to one time window is a dashboard that will be abandoned.
Funnel Analysis
Funnels reveal where users drop off. This is where deep link analytics go from "interesting" to "actionable."
Identifying Drop-Off Points
Start with the full funnel and calculate the conversion rate at each step:
Click:        10,000 (100%)
App Open:      6,200 (62%)
Screen View:   5,400 (54%)
Add to Cart:   1,800 (18%)
Purchase:        720 (7.2%)
In this example, the biggest single drop-off is between Click and App Open (38% loss). That tells you something is wrong with the link-to-app handoff. Possible causes:
- The app is not installed and the fallback page is not compelling enough to drive installs
- Universal Links or App Links are misconfigured for certain OS versions
- The link is being opened in an in-app browser that does not support deep linking
The second notable drop-off is between Screen View and Add to Cart (54% to 18%). That is a product problem, not a deep linking problem. The user landed on the right screen but was not convinced to act.
Comparing Funnels Across Channels
Build separate funnels for each channel and compare them side by side. You will often find that different channels have different weak points.
Email might have a high click-to-open rate (users already have the app) but a low conversion rate (the offer was not compelling). Social might have a low click-to-open rate (users do not have the app) but a high conversion rate among those who do open (high intent audience).
With Tolinku's charts and funnels, you can build these comparisons visually and share them with your team.
Optimizing Each Stage
Once you know where the drop-offs are, you can run targeted experiments:
| Drop-off Point | Possible Fix |
|---|---|
| Click to App Open | Fix link configuration, improve fallback page, add app install prompts |
| App Open to Screen View | Reduce app load time, fix deep link routing bugs |
| Screen View to Action | Improve the destination screen (copy, layout, CTA placement) |
| Action to Conversion | Simplify checkout, reduce form fields, offer incentives |
Cohort Analysis
Cohort analysis groups users by when they were acquired and tracks their behavior over time. For deep links, the most valuable cohort dimension is acquisition source.
Retention by Acquisition Source
Create cohorts based on the channel that brought each user in:
Cohort: Users acquired via email deep links in January 2026
  Day 1 retention:  72%
  Day 7 retention:  45%
  Day 30 retention: 28%

Cohort: Users acquired via paid social deep links in January 2026
  Day 1 retention:  61%
  Day 7 retention:  30%
  Day 30 retention: 14%
This data tells you that email-acquired users stick around nearly twice as long as paid social users. That does not necessarily mean you should abandon paid social, but it should inform how you allocate budget and how you onboard users from each channel. For more on this technique, read our full guide on cohort analysis for deep links.
LTV by Deep Link Source
Take cohort analysis one step further and calculate lifetime value (LTV) by acquisition source:
SELECT
  utm_source,
  utm_medium,
  COUNT(DISTINCT user_id) AS users,
  SUM(revenue) AS total_revenue,
  SUM(revenue) / COUNT(DISTINCT user_id) AS ltv
FROM conversions c
JOIN deep_link_clicks d ON c.user_id = d.user_id
  AND d.click_rank = 1  -- first-touch attribution
WHERE d.clicked_at >= '2026-01-01'
GROUP BY utm_source, utm_medium
ORDER BY ltv DESC;
If users acquired through QR codes in physical stores have 3x the LTV of users from paid search, that changes your strategy.
Real-Time vs. Historical Analytics
Both have their place, but they serve different purposes.
Real-Time Analytics
Real-time data matters when:
- You just launched a campaign and want to confirm links are working
- You are running a time-sensitive promotion (flash sale, live event)
- You are debugging a reported issue with deep links
- You pushed an app update and want to verify deep link routing
Real-time dashboards should show clicks per minute, active links, error rates, and platform breakdown. They do not need to show conversion data (conversions happen over hours or days, not minutes).
Historical Analytics
Historical data is where strategic decisions happen. Use it for:
- Comparing campaign performance over weeks or months
- Identifying seasonal trends in deep link engagement
- Building the cohort and LTV analyses described above
- Reporting to stakeholders on marketing ROI
For historical analysis, make sure you can export your data. CSV exports work for ad hoc analysis in spreadsheets. For automated pipelines, a dedicated analytics API is more practical.
Analytics with Tolinku
Tolinku's analytics dashboard tracks every deep link click, app open, and conversion across all your routes. Here is what it gives you out of the box.
Click tracking with device and geo data. Every click is logged with the device type, operating system, browser, country, and referrer. You can filter by any of these dimensions to understand who is clicking and from where.
Funnel visualization. Build custom funnels to track the journey from click to conversion. See exactly where users drop off and which channels perform best at each stage. The charts and funnels feature lets you compare time periods, platforms, and campaigns side by side.
Filtering and segmentation. Slice your data by date range, platform, country, UTM parameters, or route. Combine filters to answer specific questions like "How did our iOS email campaign perform in the US last week?" Tolinku's filtering tools make this straightforward.
Data export and API access. Pull your analytics into external tools for deeper analysis. Export CSV files for spreadsheet work, or use the analytics API to pipe data into your data warehouse, BI tool, or custom dashboards.
Real-time monitoring. Watch clicks come in as they happen during campaign launches. Confirm that links are resolving correctly and that traffic is flowing to the right destinations.
If you want to see how this works in practice, the Analytics and Attribution page walks through the key features.
Common Analytics Mistakes
Even with good tooling, teams make mistakes that undermine their analytics. Here are the ones that come up most often.
Tracking Clicks Without Context
A click count without source attribution is nearly useless. If you know a link got 5,000 clicks but cannot tell whether they came from email, social, or paid ads, you cannot optimize anything. Always tag your links with UTM parameters or equivalent metadata.
Ignoring Bot Traffic
Bots inflate click counts significantly, especially for links shared via email (pre-fetch bots) or posted publicly on the web (crawler bots). Look for patterns: clicks with no subsequent app open, clusters of clicks from the same IP within seconds, or clicks from known bot user agents. Filter these out before making decisions based on your data.
Comparing Channels Without Normalizing
Raw conversion numbers are misleading when channels have very different volumes. A channel with 100 clicks and 10 conversions (10% conversion rate) is outperforming a channel with 10,000 clicks and 200 conversions (2% conversion rate), even though the second channel drove more total conversions. Always compare rates, not just totals.
Setting Up Tracking After Launch
Retrofitting analytics onto an existing deep link setup is painful. You lose historical data, and migrating links to include UTM parameters means updating every link across every channel. Set up tracking before you share a single link.
Treating All Conversions Equally
A user who signs up for a free trial is not the same as a user who makes a purchase. Weight your conversions by value, or at least segment them by type. A deep link that drives 1,000 free sign-ups might be less valuable than one that drives 50 paid subscriptions.
Ignoring Platform Differences
iOS and Android behave differently with deep links. Universal Links and App Links have different edge cases, different fallback behaviors, and different user expectations. Always segment your analytics by platform. A bug that only affects Android 14 will be invisible in aggregate data.
Not Setting Baselines
You cannot evaluate a campaign's performance without knowing what "normal" looks like. Before launching a campaign, document your baseline metrics: average CTR by channel, typical conversion rate, standard app open rate. Then compare against those baselines instead of guessing whether 4.2% is good or bad.
Conclusion
Deep link analytics turn your linking infrastructure from a black box into a feedback loop. The metrics covered here (clicks, open rates, install rates, conversion rates) are the foundation, but the real value comes from connecting them into funnels, breaking them down by channel, and tracking cohorts over time.
Start simple. Track clicks and app opens. Add UTM parameters to every link. Build one funnel. Then expand from there. The teams that get the most out of their deep links are not the ones with the most sophisticated analytics stack. They are the ones who measure consistently, ask the right questions, and actually act on what the data tells them.
The tools exist to make this straightforward. The hard part is building the habit of measuring, reviewing, and iterating. Start today, and in a month you will have a clearer picture of your deep link performance than most teams ever achieve.
Get deep linking tips in your inbox
One email per week. No spam.